
Schools across the nation report student behavior, engagement and academic performance have all dipped below pre-pandemic levels. In fact, one Stanford University study found that chronic absenteeism has doubled, jumping from 15% in the 2018-19 school year to 30% in the 2021-2022 school year. The reasons for this decline are complex and much-debated. Regardless of the cause, as educators, what do we do to motivate students?
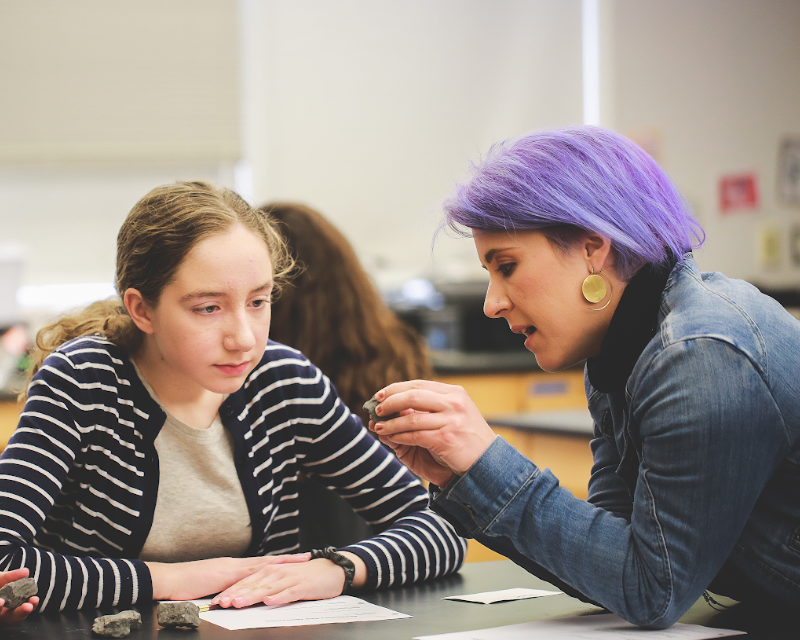
“What I find works the best is you getting to know who they are and them getting to know who you are. Then they start wanting to do better,” said Doug Page, a veteran algebra one and AP statistics teacher at the Galileo Academy of Science and Technology in San Francisco. “It takes a while,” he admitted.
Page’s approach is not a new one. In 1985 psychologists Richard Ryan and Edward Deci introduced the Self-Determination Theory of motivation. Their research found that relatedness, autonomy and competence are three major drivers of human motivation. Their findings challenged Skinnerian behaviorism and changed the way educators approached student engagement. Less carrot/stick, more connection.
A Clever Way to Get Acquainted
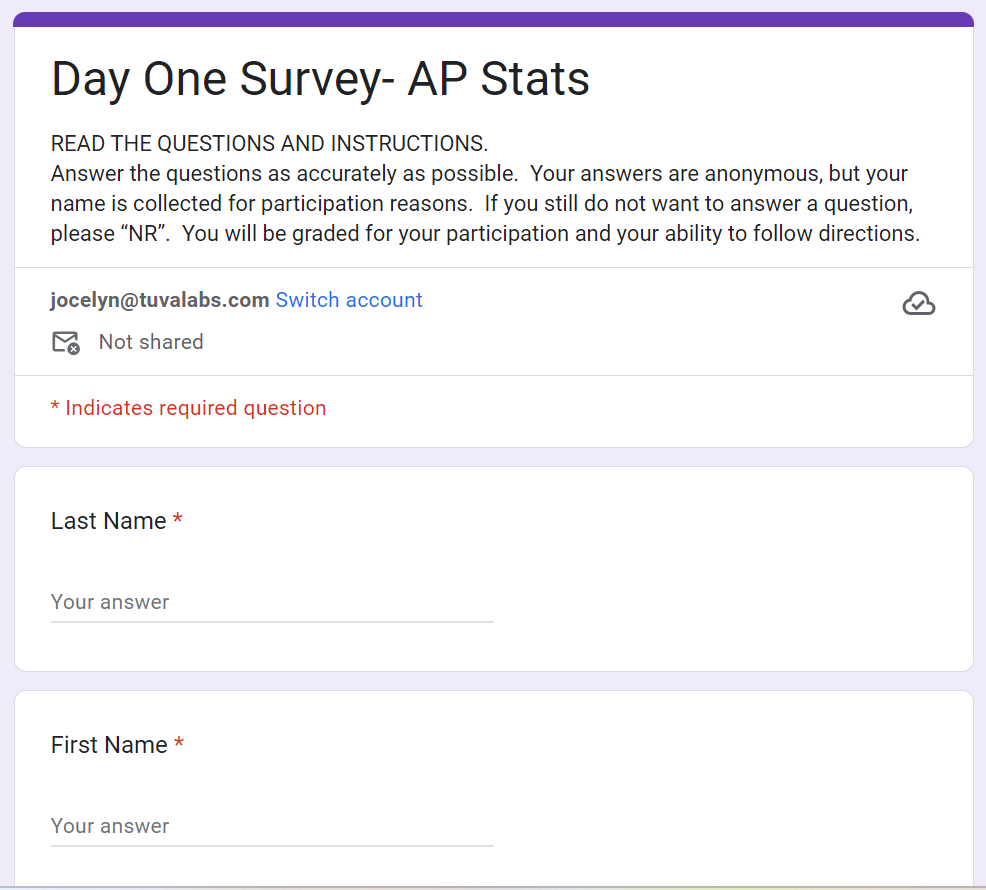
Page has found a creative way to get to know students while simultaneously introducing them to some basic statistics- collecting data. During the first few days of his AP Statistics class Page disseminates a Google survey. Students answer a variety of questions about themselves. (Try it out here.)
Some of the questions are demographic in nature. How far do you travel to get to school each day? How many siblings do you have? Other questions focus on personal habits and preferences. Do you use social media? How many texts did you send yesterday? What sports do you play?
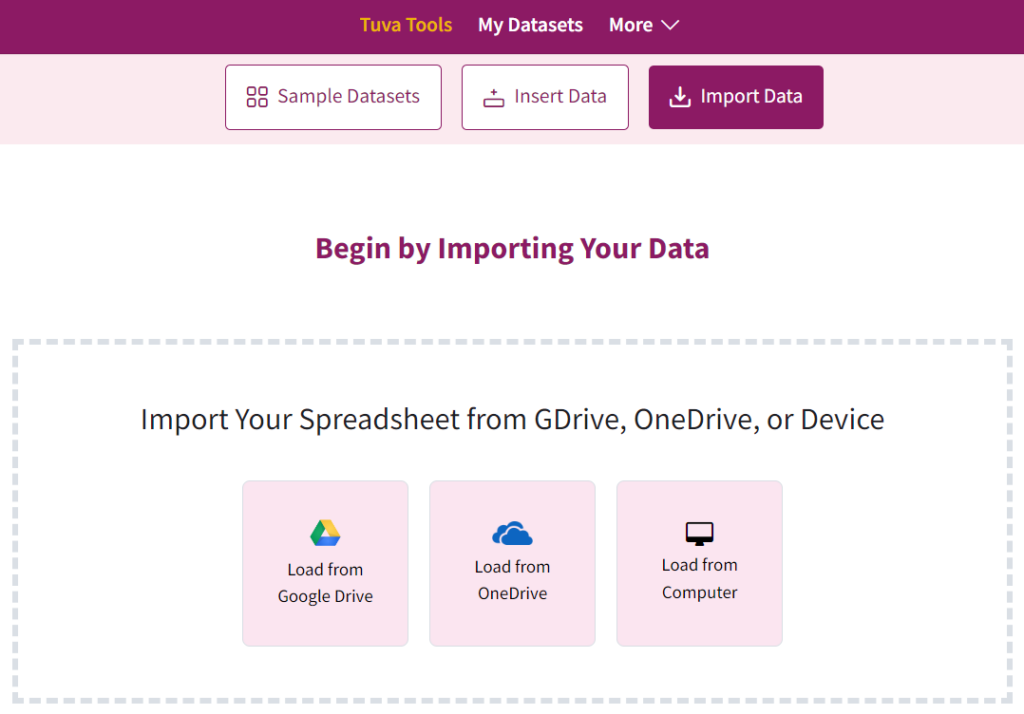
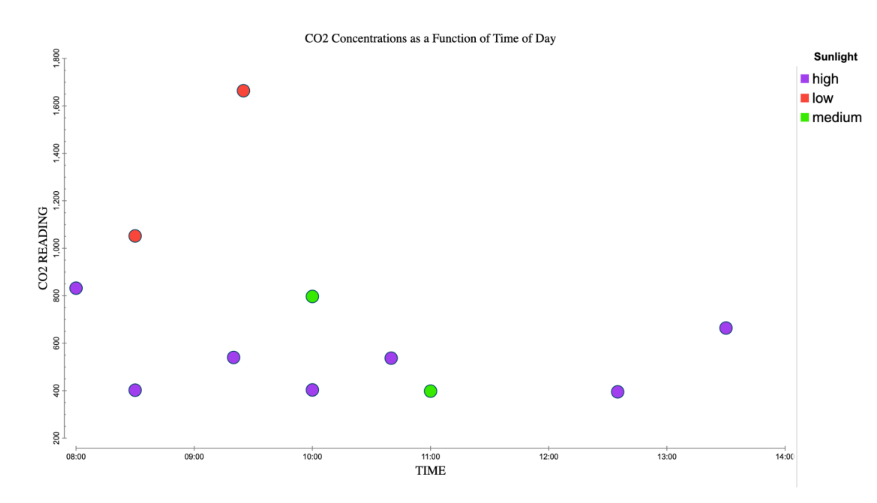
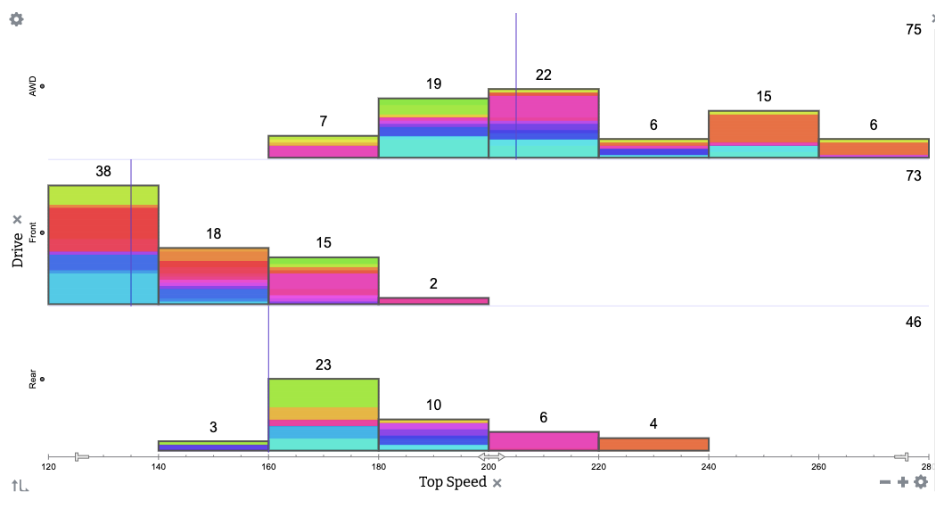
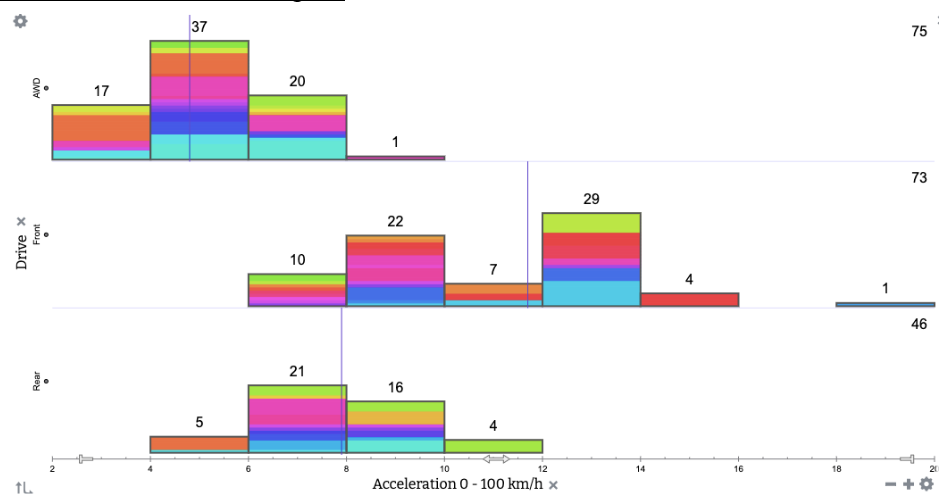
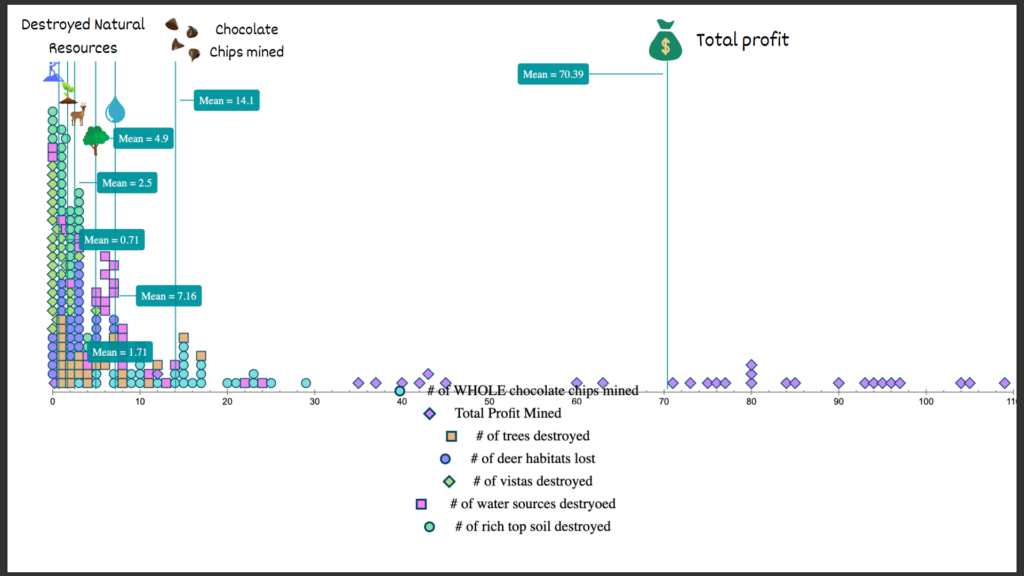
Page opens the data in a Google spreadsheet, removes student names so the data is anonymous and uploads the data to Tuva. He shares the data with his students via Tuva. Then, students can quickly ask and investigate questions about their class. In this way, Page gets to know his students, acquaints them with Tuva’s graphing tools, and introduces some foundational statistics concepts.
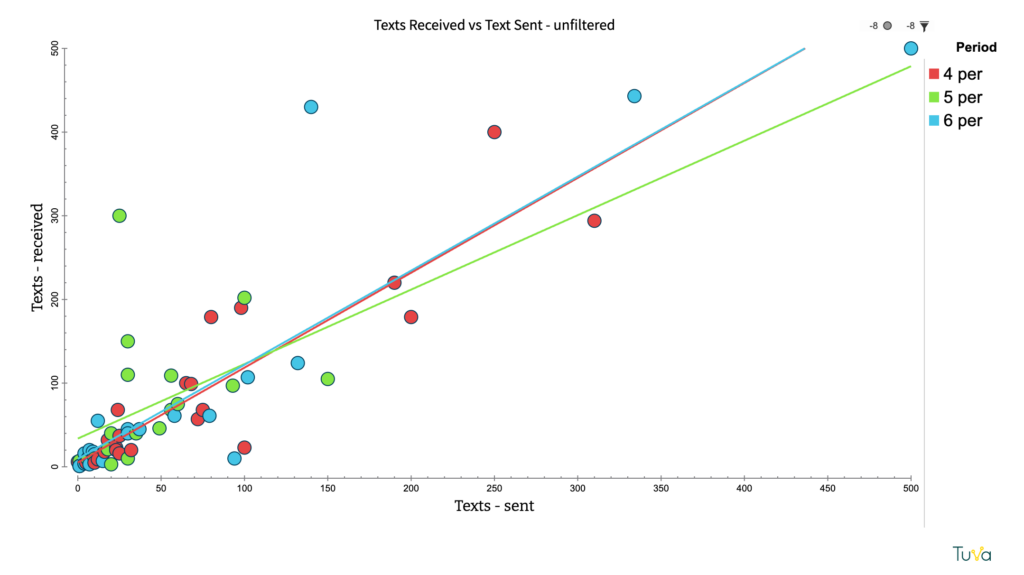
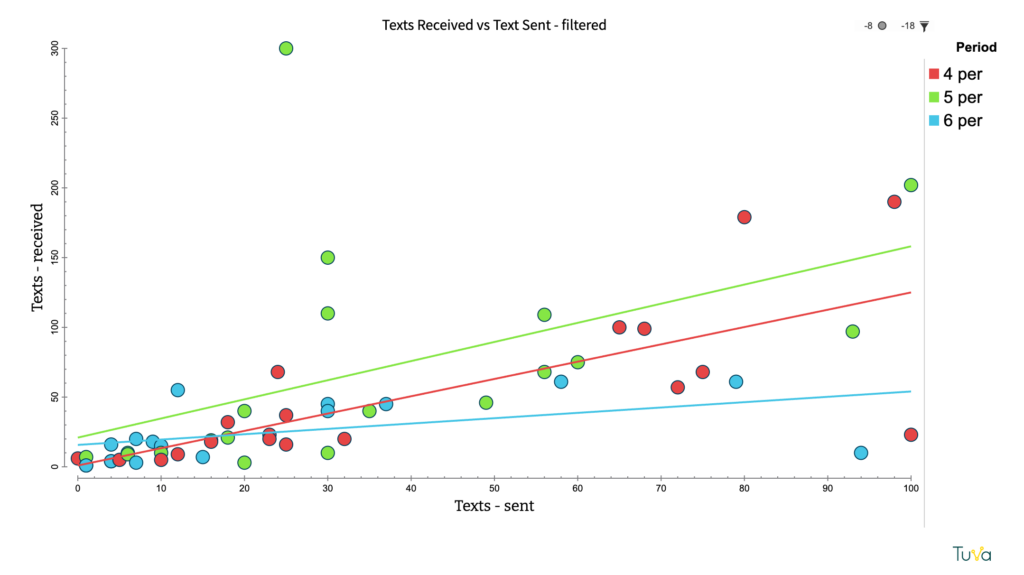
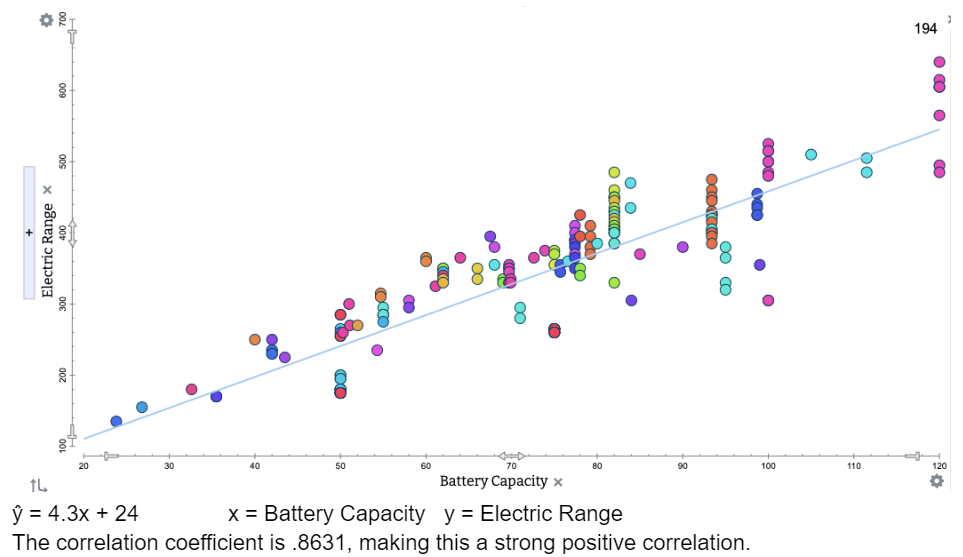
Page used texting data from the student survey to teach about linear regression. Tuva’s simple filter tool enabled him to easily demonstrate how outliers can skew the data.
Page continues to use Tuva for a variety of assignments throughout the year.
“Sometimes I want to spend the time analyzing the data, not doing all the mechanics. The mechanics are a time sink. What I love about Tuva is that it is so drag and drop. You can do so many things so quickly.”
The Bigger Picture
Not only has Tuva enabled Page to connect with his students, it has also helped him harness data about school wide indicators of student engagement, such as tardiness and absenteeism, and use it to problem solve. For example, when Page noticed high levels of tardiness during first period classes, he began to collect data. He uploaded the data into Tuva, shared it with colleagues, and launched a productive conversation about how to improve first period attendance.
Teaching is a hard profession, but it’s never a dull one.
“Students always say, ‘Isn’t it boring teaching the same thing for 25 years?’” Page said. “But while the material stays the same, the people change. I tell them, it’s not you sitting in the same seat everyday.”
Page said it is these ever-changing personalities and the opportunity to connect to each kid and find out what motivates them that keeps him going.
Want to Try It?
After you make a getting to know you survey using Google Forms, it’s easy to import your own data into Tuva from the Google Spreadsheet it generates. Visit Tuva’s support section or click this link to learn simple steps for uploading your data in Tuva.