Fostering Systems Thinking in the Middle Grades 

View from the Classroom

Foley Teaches Complexity Using Multivariate Graphs

Downpours in Uruguay, but drought in Peru.  Enormous blizzards in the northeast,  but steeply climbing worldwide temperatures. Climate science can be confusing… especially if you’re only 14 years old.  Without an understanding of complex  systems, it can seem downright contradictory. 

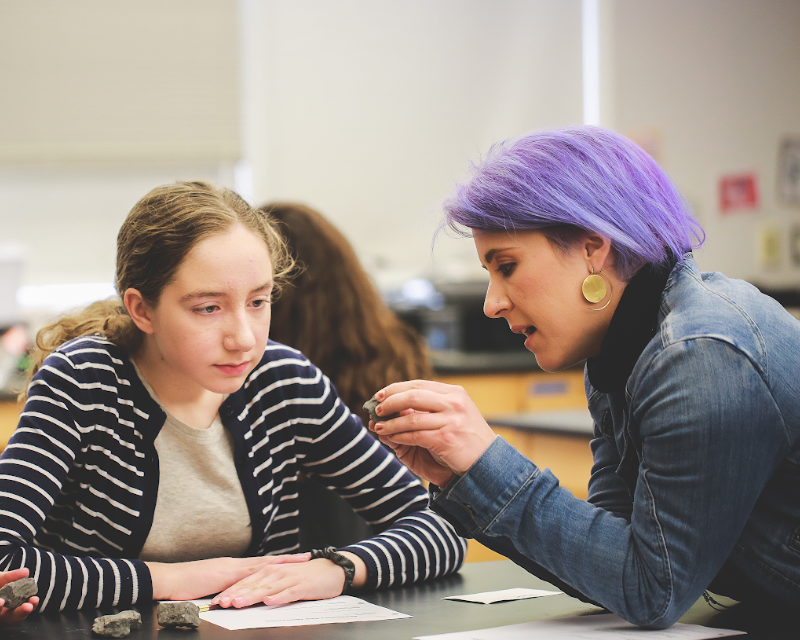
That’s why Maura Foley, an earth and climate science teacher at the Hopkins School in Connecticut, devotes significant energy to helping her students investigate systems interactions.

“Today’s problems are complex problems, so we need thinking that is going to reach outside of these discrete zones of understanding,” said Foley. 

Foley admits that  understanding complexity is part of higher order, abstract thinking – an easier task for her high school students than her middle school students. However, she believes it’s essential to begin building the idea of complexity in the lower grade bands. In her middle school courses, the process of building that understanding starts with noticing how one thing affects another, which affects another, and so on. 

“Today’s problems are complex problems, so we need thinking that is going to reach outside of these discrete zones of understanding.”

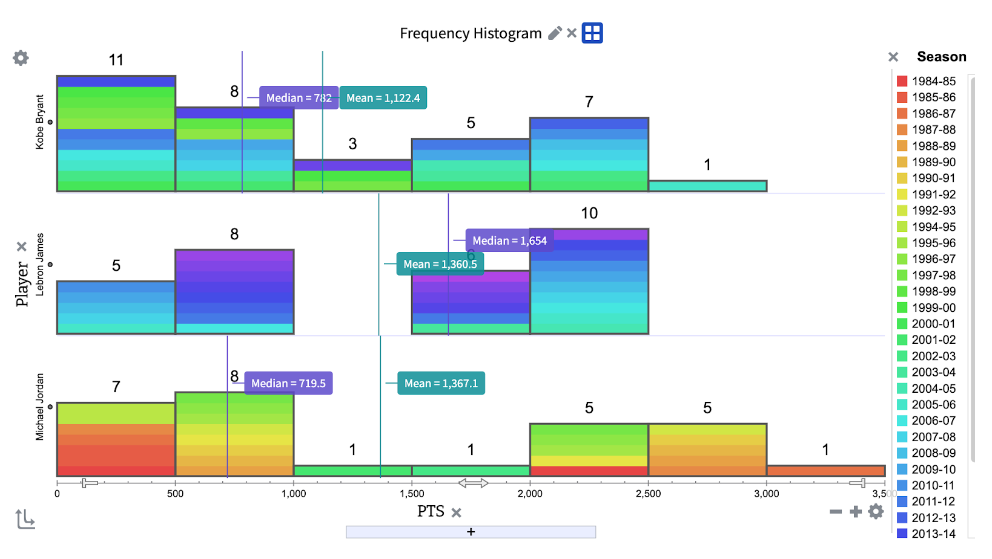
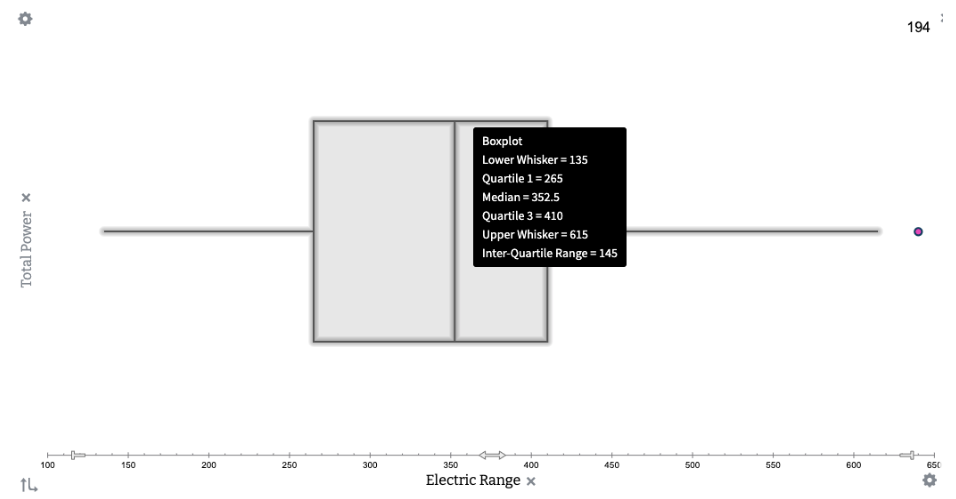
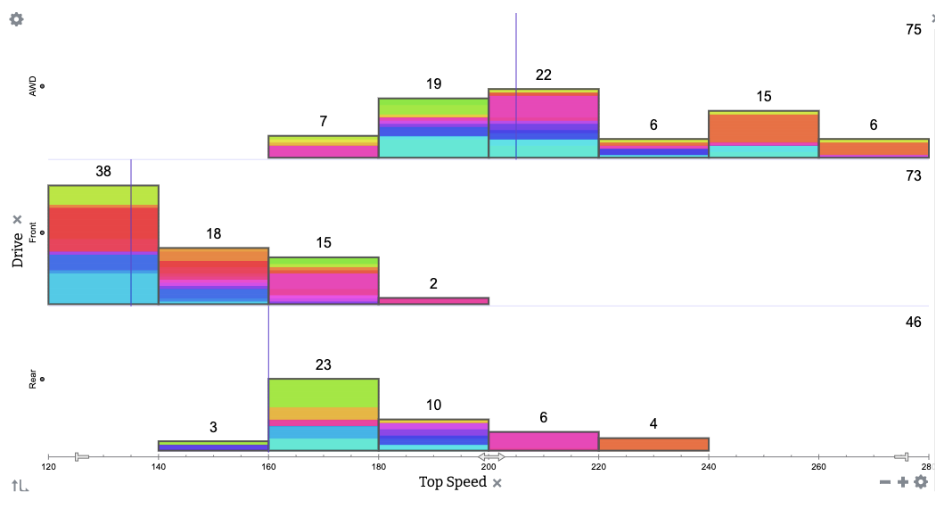
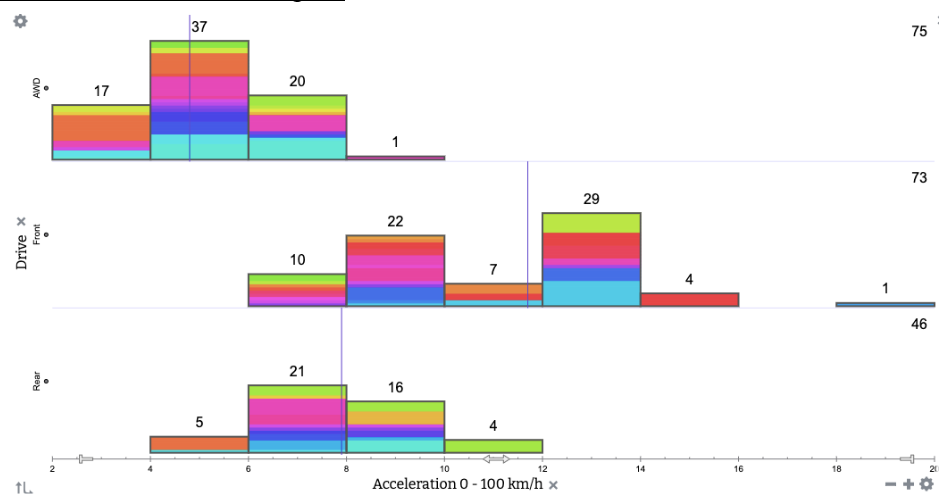
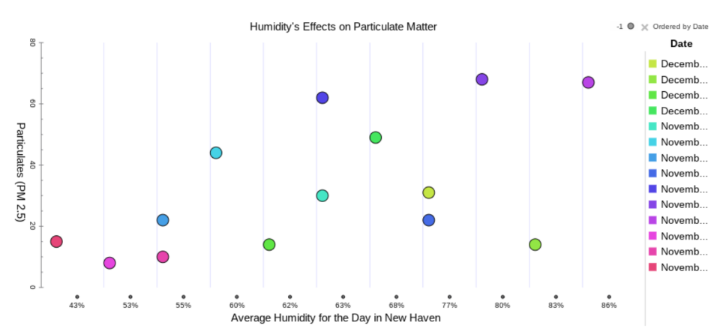
“What’s great about Tuva is being able to blow through looking at a whole bunch of variables quickly,” explained Foley. “They don’t need to be a spreadsheet expert to quickly go ahead and make 10 graphs.” 

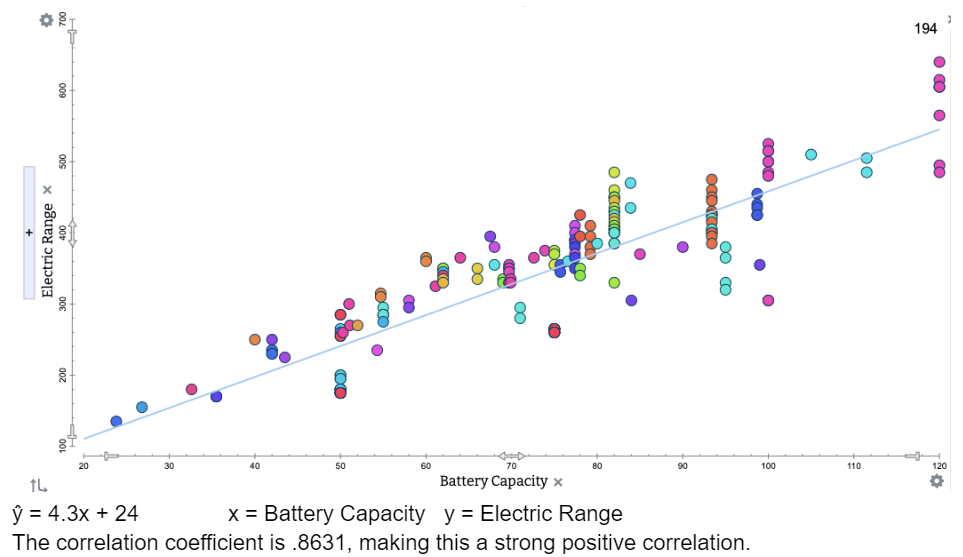
Foley uses Tuva activities and datasets consistently throughout her Surface to Space class in 8th-grade. Each dataset includes multiple, interconnected variables that students can drag and drop onto the axes to explore correlations.

Global Change Dataset Image
October Weather in US Cities Datset Image
New England Ice-Out Dates, Global Change and October Weather in US Cities are a few Tuva datasets Foley’s students use to explore complex earth and climate systems.

When students first use Tuva, she said there tends to be some oohs and aahs as they watch the dots rearrange themselves. Then, Foley starts to hear students verbalizing the patterns they observe.

“Those observations are able to keep going and going because it’s not like I’ve handed them a simple graph,” said Foley.   

Graph Showing Positive Relationship Between Humidity and Particulate Matter
This graph, created by an 8th-grader in Foley’s class, investigated the relationship between particulate matter and humidity.

Foley has observed that once students notice one relationship, they begin to wonder if other variables are related. Tuva allows them to quickly and easily satisfy their curiosity. It starts a deeper conversation in which students begin to comprehend the complexity of Earth’s systems. 

In addition to middle school science, Foley teaches a high school elective: Engineering Nature. In this higher level class, Foley expects her students to apply their understanding of interconnectedness to tackle pressing issues, such as climate change. Last year her students made biogeochemical terrariums and tracked CO2 concentrations over time. Then they geoengineered the terrariums to reduce the CO2 concentrations.

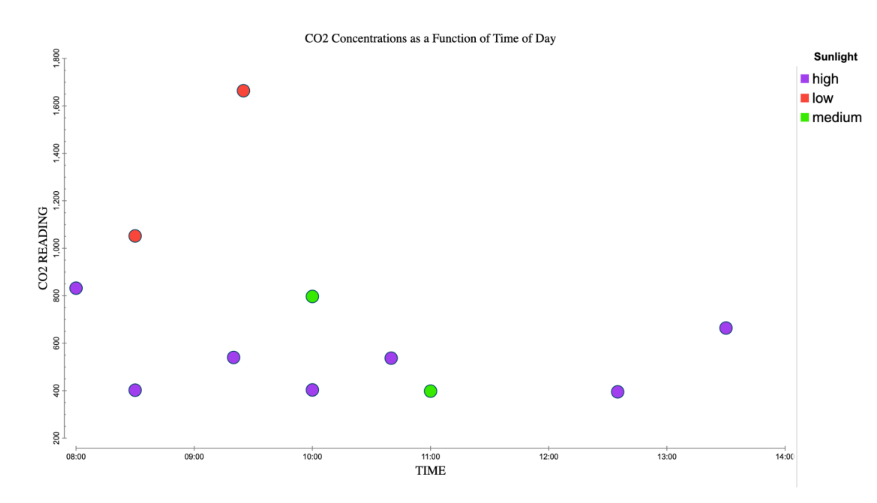
Foley’s emphasis on interconnected systems when these students were in the middle grades prepared them to take on this rigorous geoengineering challenge. In the long term, Foley‘s students will be prepared to face the complex problems of a complex world.

Stats Teacher Drives Engagement with Authentic Data

Relevance Prompts Annie Pettit’s Students to Dive Deeper  

Teacher Annie Petit

Annie Pettit has taught a variety of different high school math courses during her 18-year career, but her self-professed passion is statistics. She gravitates toward stats because it provides multiple opportunities to use real-world data. 

“As much as possible, I try to get data that relates to the kids, data they are excited about or that they can relate to,” Pettit said.

histogram comparing points scored/season by Kobe Bryant, LeBron James and Michael Jordan
Engagement is high when the data is relevant to kids, such as the NBA statistics this student analyzed to determine the GOAT (greatest of all time).

Pettit designs her statistics course at Des Moines Christian School so that assignments earlier in the year are more supported. First, she acquaints students with the Tuva graphing tools using a premade Tuva activity with step-by-step directions. Then, she assigns a simple comparison project in which students can use these tools to create dot plots and box plots about data that’s personally meaningful. Students select a topic independently. DC Comics vs Marvel Comics profits, passing yards from last season’s football season, viewership for The Office vs. Friends, the US women’s national team vs the men’s national team – the topics are as varied as Pettit’s students.

Pettit continues to  ratchet up the rigor throughout the year, so that by quarter four students are ready to “do stats like a statistician does” using large datasets and lots of variables.

“If you put data in front of them that interests them… they actually want to find out the answer instead of doing it to get it done.”

Last year she gave her statistics students five options of datasets to choose from for their final project: electric cars, basketball statistics, baseball statistics, state crime rates or movie production budgets. Pettit noted that real-world data motivates students at all different levels – those to whom math comes easily, and those who have to work a bit harder to master statistical concepts.

“If you put data in front of them that interests them or if they get to pick their own data, they actually want to find out the answer instead of doing it to get it done.”

A few graphs from one student’s final project about electric car performance.

The depth and insight shown in her students’ work is a testament to their level of engagement. For example, a student investigating electric car performance reflected that statistical analysis often challenges our assumptions, and variables that seem like they would be correlated don’t correlate at all.

Pettit prefers to have students analyze these authentic datasets in Tuva where they can focus on justifying their conclusions instead of on the logistics of making the graphs.

“Tuva makes statistics come alive!” Pettit said. “Tuva allows my students to be statisticians. They are able to analyze big datasets and draw conclusions from data they find relevant to their lives.”