
Foley Teaches Complexity Using Multivariate Graphs
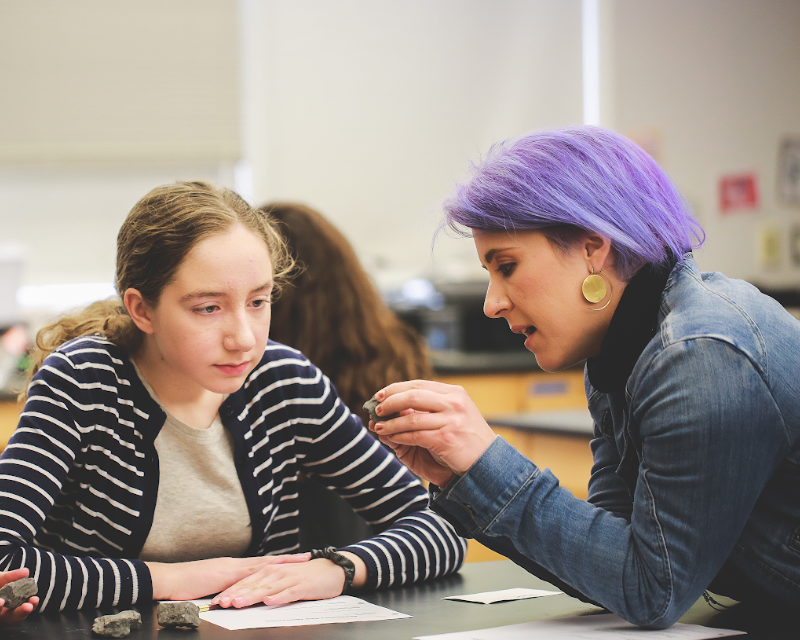
Downpours in Uruguay, but drought in Peru. Enormous blizzards in the northeast, but steeply climbing worldwide temperatures. Climate science can be confusing… especially if you’re only 14 years old. Without an understanding of complex systems, it can seem downright contradictory.
That’s why Maura Foley, an earth and climate science teacher at the Hopkins School in Connecticut, devotes significant energy to helping her students investigate systems interactions.
“Today’s problems are complex problems, so we need thinking that is going to reach outside of these discrete zones of understanding,” said Foley.
Foley admits that understanding complexity is part of higher order, abstract thinking – an easier task for her high school students than her middle school students. However, she believes it’s essential to begin building the idea of complexity in the lower grade bands. In her middle school courses, the process of building that understanding starts with noticing how one thing affects another, which affects another, and so on.
“Today’s problems are complex problems, so we need thinking that is going to reach outside of these discrete zones of understanding.”
“What’s great about Tuva is being able to blow through looking at a whole bunch of variables quickly,” explained Foley. “They don’t need to be a spreadsheet expert to quickly go ahead and make 10 graphs.”
Foley uses Tuva activities and datasets consistently throughout her Surface to Space class in 8th-grade. Each dataset includes multiple, interconnected variables that students can drag and drop onto the axes to explore correlations.

When students first use Tuva, she said there tends to be some oohs and aahs as they watch the dots rearrange themselves. Then, Foley starts to hear students verbalizing the patterns they observe.
“Those observations are able to keep going and going because it’s not like I’ve handed them a simple graph,” said Foley.
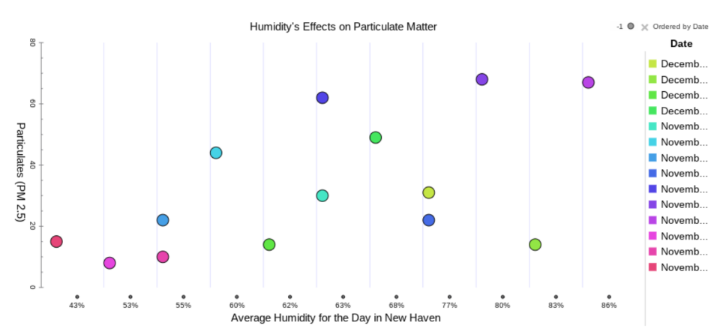
Foley has observed that once students notice one relationship, they begin to wonder if other variables are related. Tuva allows them to quickly and easily satisfy their curiosity. It starts a deeper conversation in which students begin to comprehend the complexity of Earth’s systems.
In addition to middle school science, Foley teaches a high school elective: Engineering Nature. In this higher level class, Foley expects her students to apply their understanding of interconnectedness to tackle pressing issues, such as climate change. Last year her students made biogeochemical terrariums and tracked CO2 concentrations over time. Then they geoengineered the terrariums to reduce the CO2 concentrations.
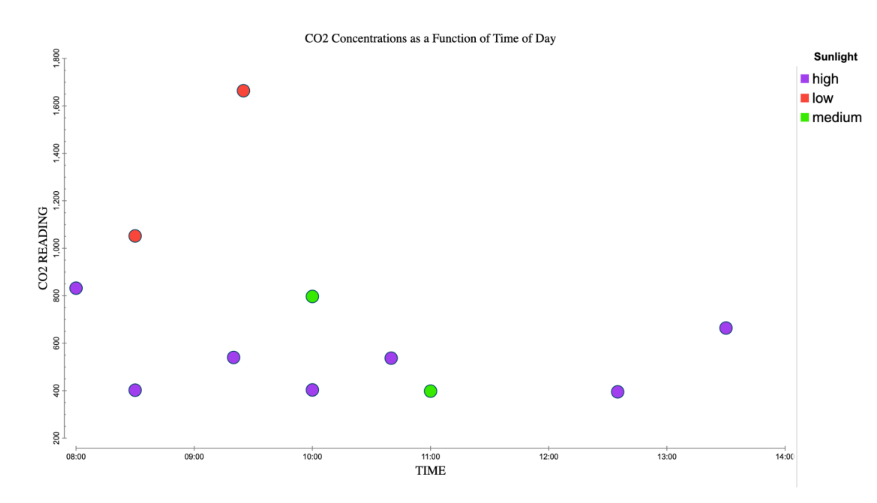
Foley’s emphasis on interconnected systems when these students were in the middle grades prepared them to take on this rigorous geoengineering challenge. In the long term, Foley‘s students will be prepared to face the complex problems of a complex world.