Science Teacher Margo Murphy Does Science From Day One
When most people think “back to school,” it conjures images of students seated at a desk, their heads bent over their computers and papers. In Margo Murphy’s Earth Systems Science classroom, though, “back to school” has a different meaning. Murphy jumps right into doing science. That means the first days back find her students outside in their Rockport, Maine schoolyard collecting data.
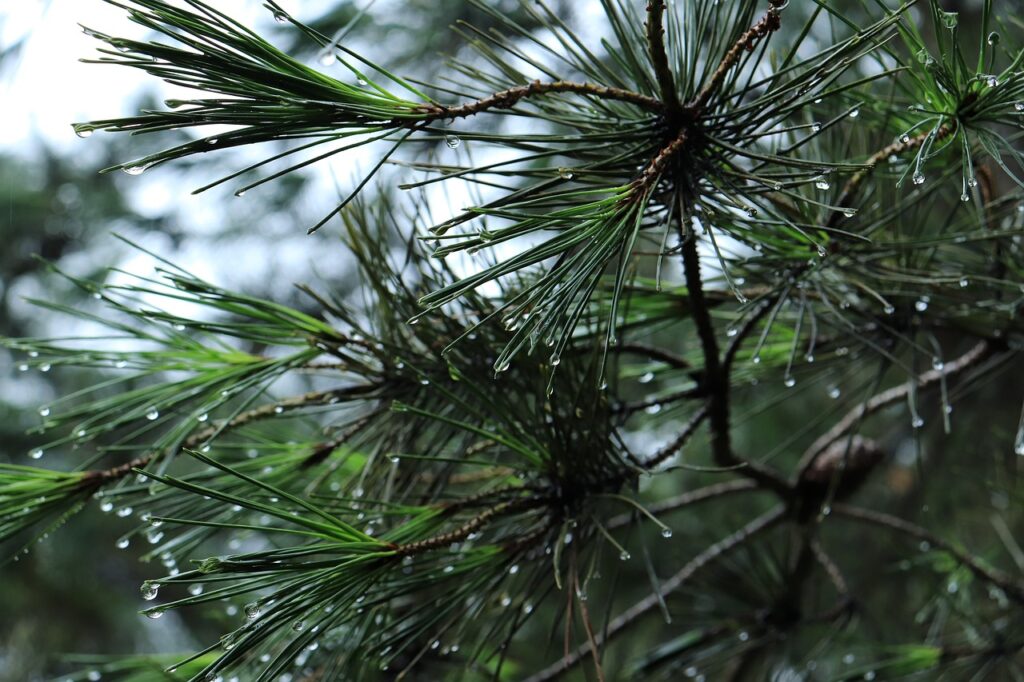
At first, the content of the investigation doesn’t matter; what matters is if observational data can be gathered to answer the question. Each group picks a question that sparks their interest. For logistical purposes, Murphy limits them questions they can answer on campus. For example, one group of students might be measuring the length of white pine needles to see how variable they are while another is documenting the brands, models and colors of vehicles in the school parking lot. The purpose?
“It gives kids the idea that you can have highly variable data but still see trends,” Murphy explained. This is fundamental in her Earth Systems course, she elaborated. “You are going to have messy data if you are going to work in the earth sciences.” Murphy and her Earth Systems colleagues at Camden Hills Regional High School consider data literacy so essential to the earth sciences that they devote a significant portion of the first quarter helping their students master it.
“They don’t have to focus on getting it ‘right’ the first time, so they can iterate.”
Once students have collected data, they upload their data on Tuva and begin to explore it. Murphy’s students always enjoy the “playground aspect” of Tuva, being able to bring data in and look at it in a variety of ways. To capitalize on this engagement, Murphy builds in time for her students to “play”.
“[With Tuva] they don’t have to focus on getting it ‘right’ the first time, so they can iterate,” Murphy said.
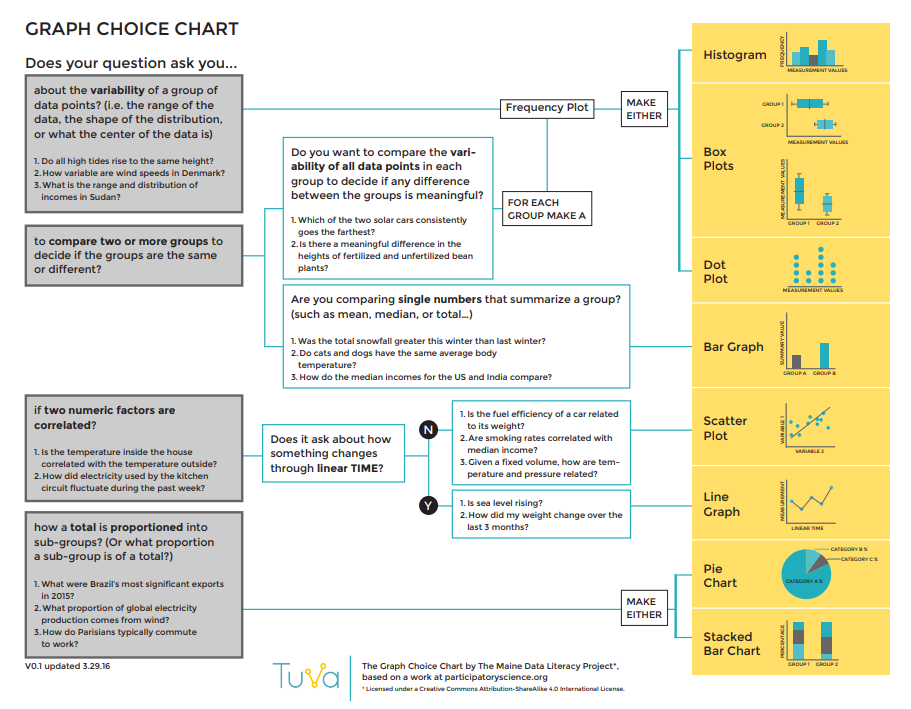
Murphy scaffolds learning using Tuva’s graph choice chart.
As students are becoming conversant with analyzing complex data, Murphy scaffolds the learning process using Tuva resources like the graph choice chart.
The time and energy devoted to data literacy pays dividends later in her course as students grapple with complex earth systems core ideas such as weather and climate, topics which Murphy considers vitally important.
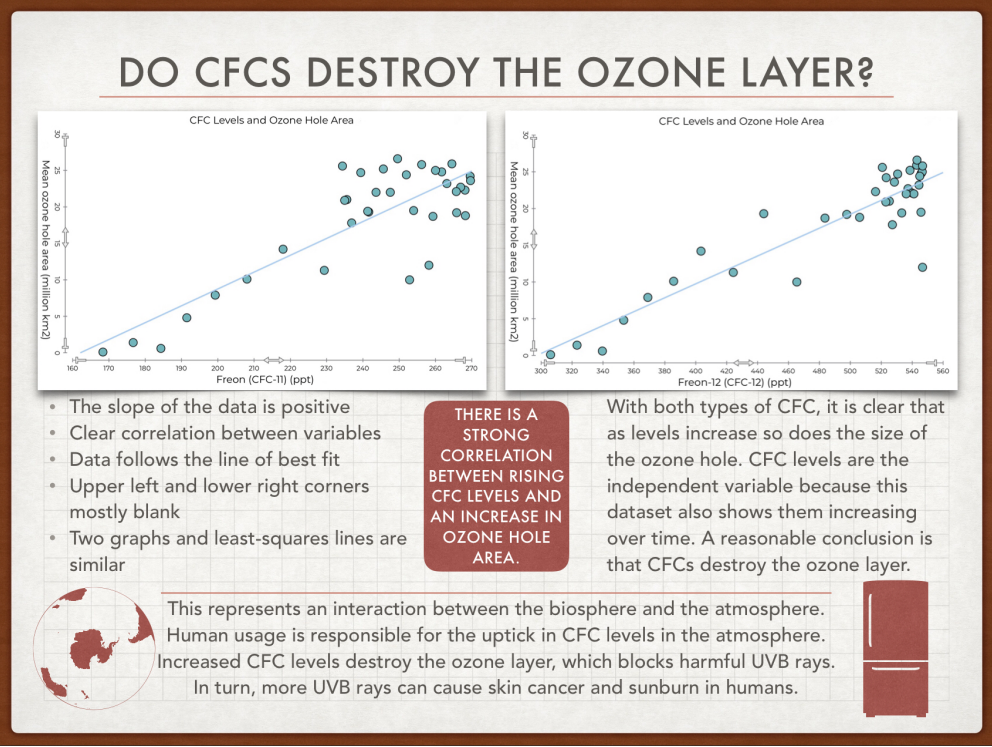
Murphy introduces data skills early, preparing students to apply them to projects like this one later in the course.
“I want kids to understand that there is change on the planet, that this change is rapid, and how they can find evidence and understand that evidence to understand these changes and ask good questions.”