
Relevance Prompts Annie Pettit’s Students to Dive Deeper
Annie Pettit has taught a variety of different high school math courses during her 18-year career, but her self-professed passion is statistics. She gravitates toward stats because it provides multiple opportunities to use real-world data.
“As much as possible, I try to get data that relates to the kids, data they are excited about or that they can relate to,” Pettit said.
Pettit designs her statistics course at Des Moines Christian School so that assignments earlier in the year are more supported. First, she acquaints students with the Tuva graphing tools using a premade Tuva activity with step-by-step directions. Then, she assigns a simple comparison project in which students can use these tools to create dot plots and box plots about data that’s personally meaningful. Students select a topic independently. DC Comics vs Marvel Comics profits, passing yards from last season’s football season, viewership for The Office vs. Friends, the US women’s national team vs the men’s national team – the topics are as varied as Pettit’s students.
Pettit continues to ratchet up the rigor throughout the year, so that by quarter four students are ready to “do stats like a statistician does” using large datasets and lots of variables.
“If you put data in front of them that interests them… they actually want to find out the answer instead of doing it to get it done.”
Last year she gave her statistics students five options of datasets to choose from for their final project: electric cars, basketball statistics, baseball statistics, state crime rates or movie production budgets. Pettit noted that real-world data motivates students at all different levels – those to whom math comes easily, and those who have to work a bit harder to master statistical concepts.
“If you put data in front of them that interests them or if they get to pick their own data, they actually want to find out the answer instead of doing it to get it done.”
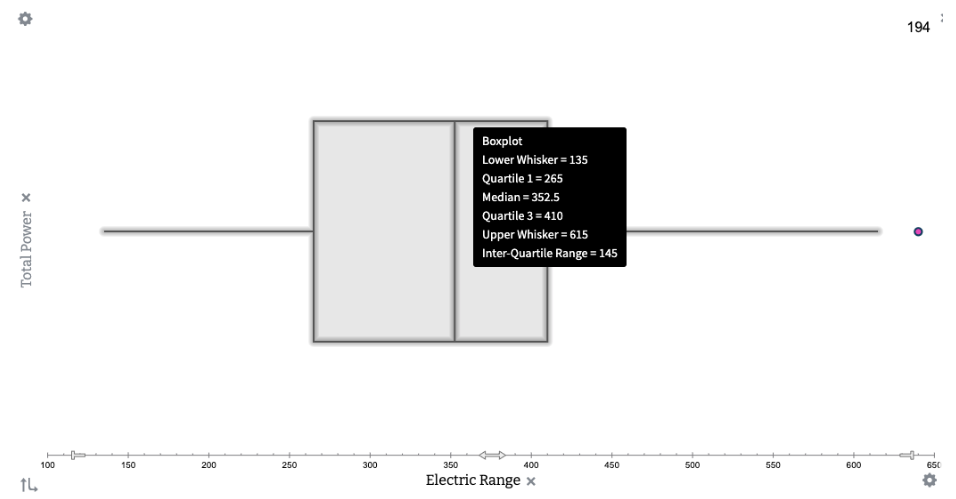
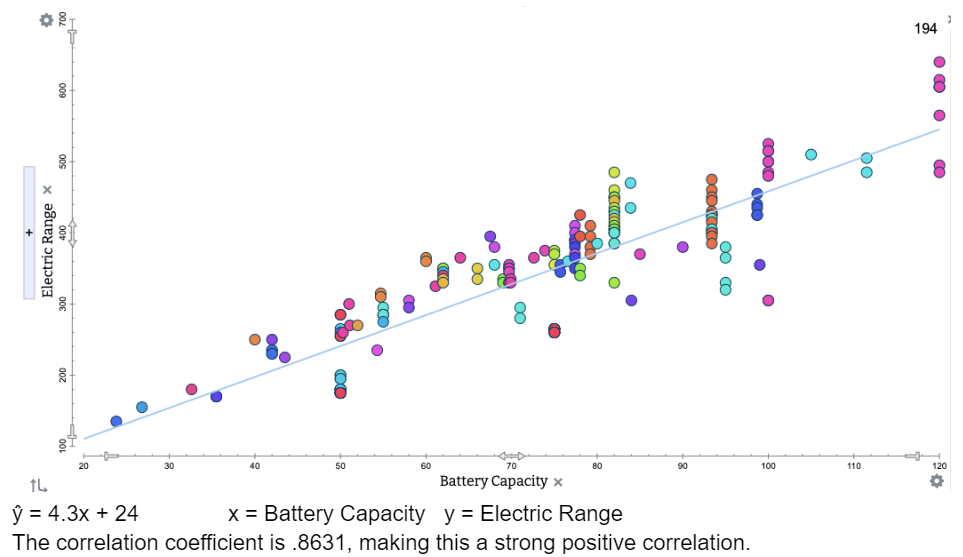
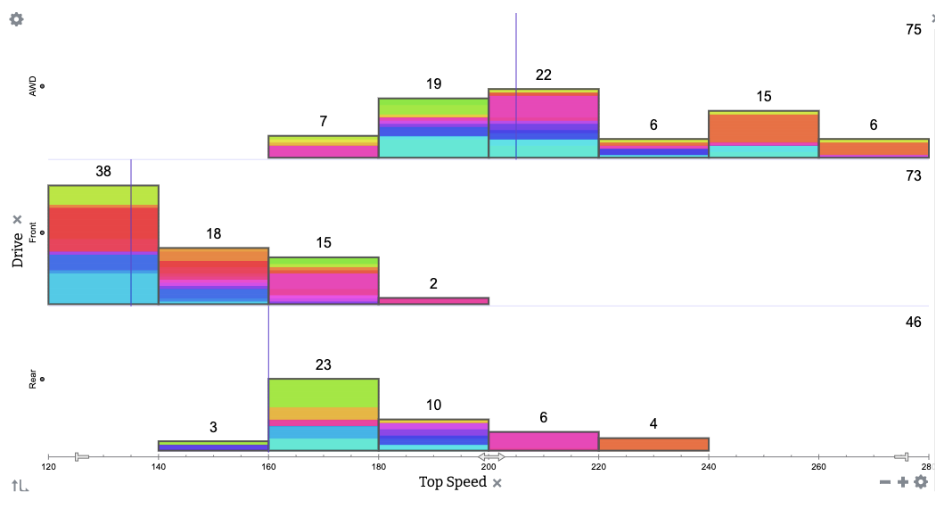
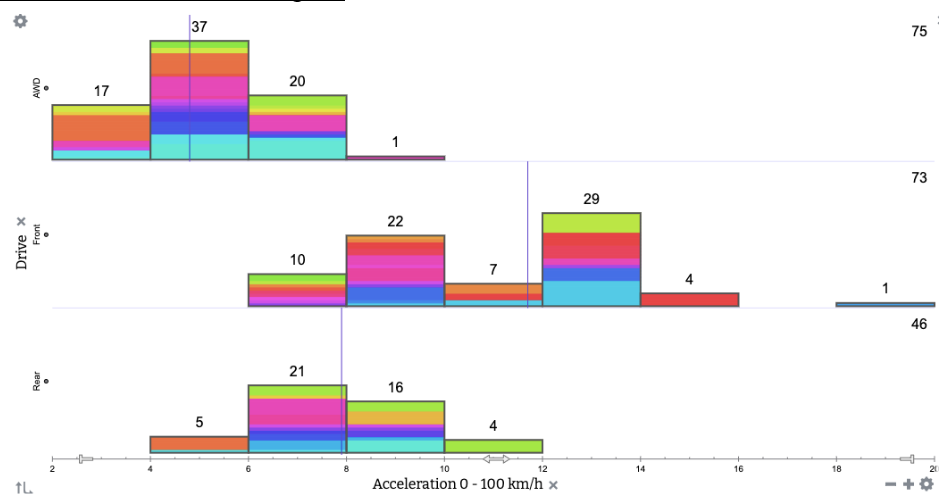
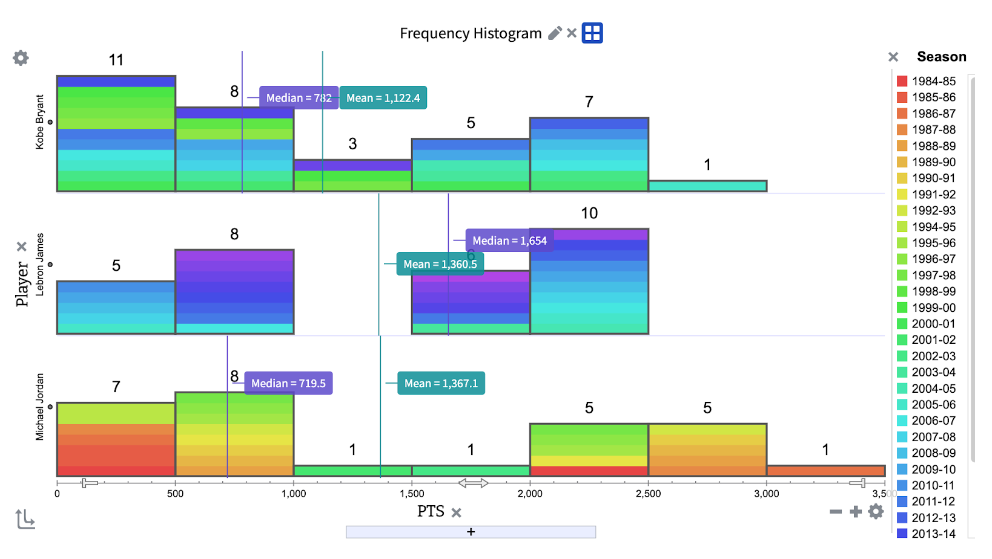
A few graphs from one student’s final project about electric car performance.
The depth and insight shown in her students’ work is a testament to their level of engagement. For example, a student investigating electric car performance reflected that statistical analysis often challenges our assumptions, and variables that seem like they would be correlated don’t correlate at all.
Pettit prefers to have students analyze these authentic datasets in Tuva where they can focus on justifying their conclusions instead of on the logistics of making the graphs.
“Tuva makes statistics come alive!” Pettit said. “Tuva allows my students to be statisticians. They are able to analyze big datasets and draw conclusions from data they find relevant to their lives.”