Unique Approach Reveals Cross-Cultural Application of Mathematics
“The disconnect between the high school curriculum and students’ lives is all too common, particularly in math, and it frustrates me.”
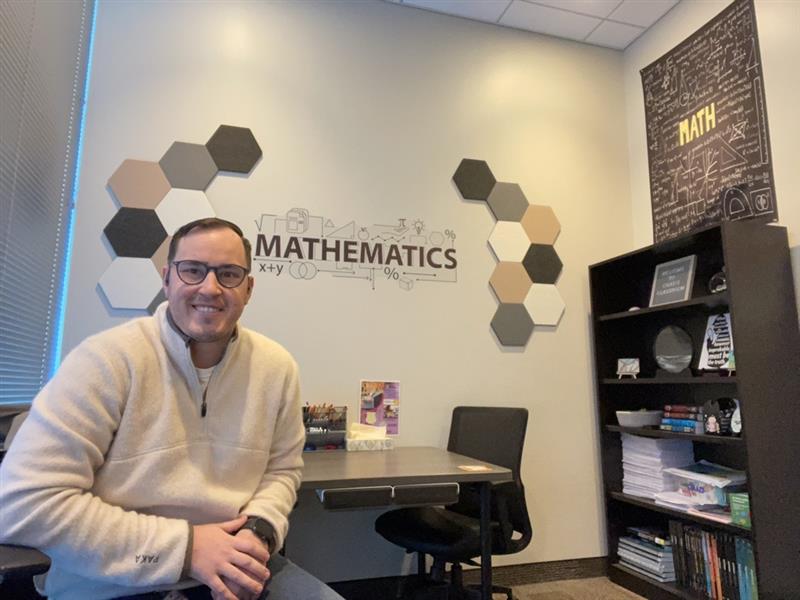
High school math teacher Gerald Smith is concerned about mathematics instruction in the United States.
Smith’s concerns are shared by others, including the National Council of Teachers of Mathematics. In a May 2024 position statement, the council expressed dissatisfaction with traditional modes of instruction which leave “students feeling a disconnect” and encouraged educators to humanize mathematics, to help students see math as a creative process of exploring and interacting with the world.
Smith has been teaching math for more than 20 years. He currently teaches pre-algebra and geometry at Indiana Area Senior High School in Indiana, Pennsylvania, and has been there for more than a decade. Previously, he taught abroad in Namibia and Eritrea.
In his efforts to help students see math as a vehicle for solving problems, Smith incorporates authentic applications from various cultures into his instruction. By using both local and international examples of mathematics applications, Smith helps students see math as something that is both universal and diverse. Tuva helps him do that.
Missing the Application for the Tools
“Math classes should be about how we use this tool of mathematics to understand the world around us,” explained Smith. “Many state and national exams focus too much on the tool itself, and not how it is used. It’s like being in a carpentry class, and only studying the power drill, not what you can do with it.”
“It’s like being in a carpentry class and only studying the power drill, not what you can do with it.”
This perspective is shared and elaborated upon further in the book Math is a Verb by professors Jim Barta, Ron Eglash, and Cathy Barkley. Their book challenges the perception of math as a set of static rules written in ancient times.
“Across the globe, people who would never be considered mathematicians are engaged with mathematical activities in the work they complete, the artifacts they construct, or the objects they design,” they counter. Furthermore, “mathematics is best understood as we experience its application within the cultures and contexts in which it is applied.”
Going Global
Smith’s most recent attempts to reveal mathematics as a living, breathing, multicultural discipline brought him to Greece. All teachers in his district are eligible for a partially paid sabbatical after their first 10 years of teaching. In anticipation, he applied for and was awarded a scholarship from the Fulbright Distinguished Awards in Teaching Research Program. Smith spent his six-month sabbatical gathering data in Greece and networking with educators and policymakers who live there.
He returned with a collection of self-made lesson plans. The lessons simultaneously address key mathematical concepts and reveal how communities in Greece are applying math to solve real-world problems. Each of his lessons utilizes authentic data gathered from a municipality or other civic organization in Greece.
Using Linear Regression to Predict Water Supply
Smith has a blog called Mr. Smith’s Mathbox where you can read about his adventures in Greece and access his lesson materials. The link for Lesson 1 will bring you to Tuva and a lesson titled, “Is the rain going to be enough?”
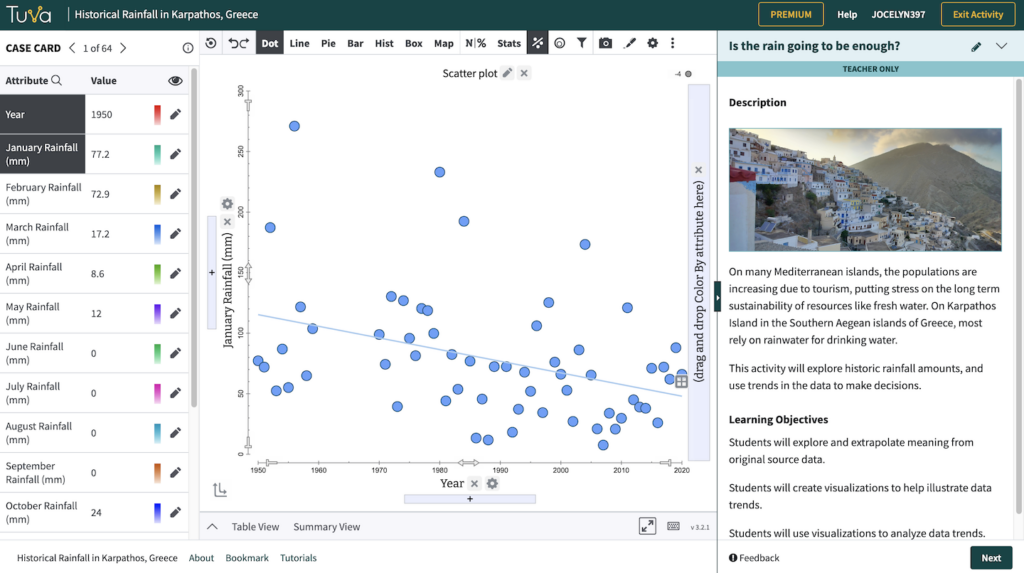
The lesson confronts students with an issue facing municipal leaders on the island of Karpathos, Greece. Even as a long-anticipated reservoir is being built, rainfall is decreasing and population is increasing. They’re worried the supply of drinking water will not meet demand. Smith challenges students to use linear regression to model rainfall and population levels by 2030 and predict whether or not the reservoir will be adequate.
Finding the Right Tool
Real-world data can be hard to comprehend without the right scaffolding. Smith discovered the Tuva Tools when he was searching for a way to enable his students to actively and independently explore the datasets he’d gathered. He decided it would be a good fit for his project.
“The tool is so powerful, especially for kids who don’t identify themselves as data folks,” he explained.
Smith worked with Tuva to get his datasets added to the Dataset Library. Then, he used the Tuva Activity Builder to create his own lessons.
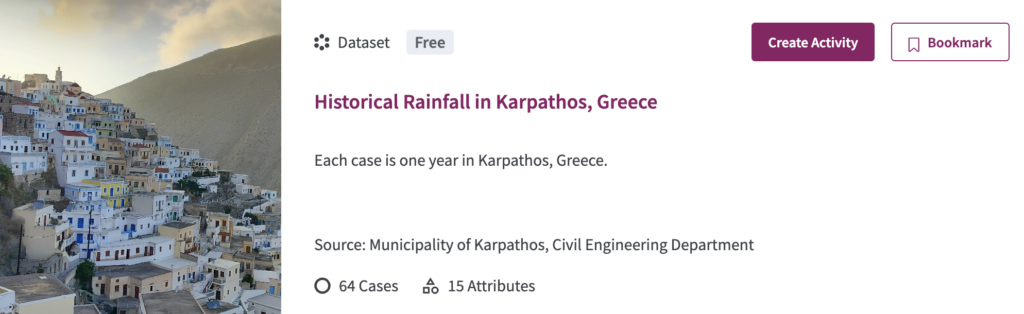
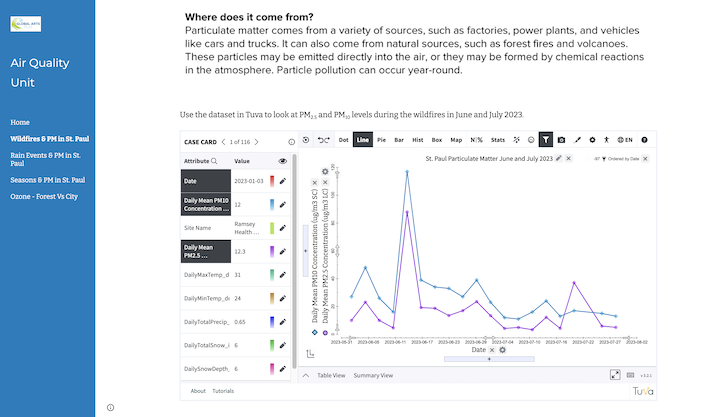
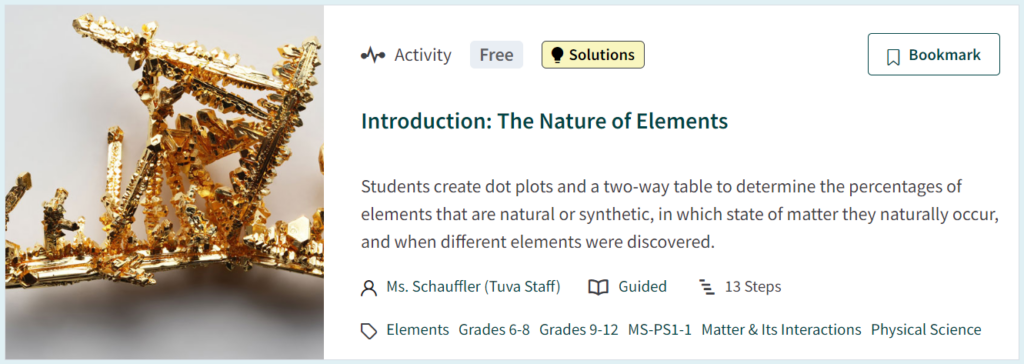
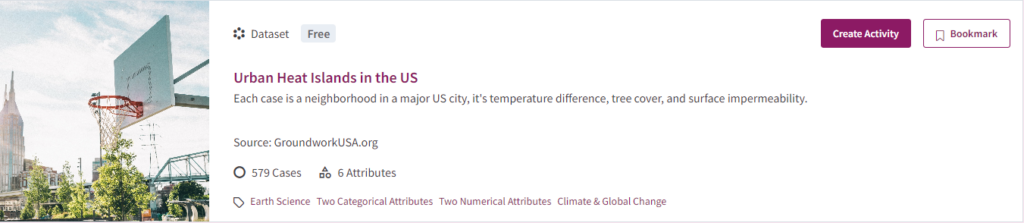
Tuva’s Activity Builder enables users to create their own lessons based on datasets in Tuva’s Dataset Library. (Subscribers can create activities using any of the > 400 datasets in the library, and Basic users can create activities using any of the datasets marked “free”.)
Smith has integrated the Tuva tools into three of his other lessons as well. In “Island Hopping” students use data to make a recommendation to the Ios municipality on whether the island can support more swimming pools. (Below, explore the Ios dataset using the Tuva tools.)
Students note trends in how tourists are arriving and where they are lodging in Smith’s “Hypertourism” and “Sleeping in Santorini” lesson sequence. Then they use linear models to predict how many beds will be needed in basic vs. luxury accommodations in the coming years.
Best Understood Indeed
The common denominator in these lessons is context. If, as Barta et al. stated, “mathematics is best understood as we experience its application within the cultures and contexts in which it is applied,” Smith’s students will leave his class with a deeper comprehension of the underlying meaning of mathematics.
Want to Play?
Tinker with Smith’s four Greece datasets on Tuva for free until the end of November.