Real-world pedagogy and data literacy are at the heart of Tuva’s mission. Today, we are advancing that work further by enabling you to create custom activities in Tuva using your own data.
The Tuva Activity Builder allows you to place your best lesson ideas beside our powerful, accessible data visualization tools. That means the ability to quickly explore data and create, revise, and analyze graphs will be right at your students’ fingertips.
Five Reasons to Take Advantage of Tuva’s New Activity Builder
1. Strengthen Connection, Deepen Comprehension
Collect data with your students one day, then incorporate their dataset into a lesson on Tuva for the following day. Students will have a deeper connection to and comprehension of the data when they’ve collected it personally.
This deep involvement in the entire science process–from collection to sophisticated visualization and analysis–helps students see themselves as scientists, not just people learning about science.
2. You Pick the Phenomena, We Provide the Tools
Your creativity far exceeds the bounds of our Science Content Library; we simply cannot encompass every possible anchoring phenomenon. The ability to craft lessons in Tuva from your own datasets allows you to stick closely to your anchor phenomenon without sacrificing the benefits afforded by the Tuva tools.
3.Create Lessons That Speak to Your Students
Relevance drives student engagement. Use local data to center your math or science lessons around places familiar to your students. Alternatively, capitalize on your students’ unique personalities by pulling in data about topics you know interest them.
4.Make Graphing Accessible to All Learners
Our tools are designed to be accessible for learners with diverse abilities. So, when you create your lesson in Tuva you can rest assured all students will be able to engage meaningfully with data. (Learn more about Tuva’s Commitment to Accessibility.)
5.Strut Your Stuff and Help Make the Future #DataLit
You’re brilliant. Your work should be shared. You can now enable school colleagues and far-flung teacher friends to use more data in their instructional practice by sharing a direct link to your original lessons in Tuva. (And while you’re at it, remind them to hit you back. It’s a team effort.)
How to Get Started Building Lessons
Select My Datasets on the Dataset Library dropdown.
Insert or upload data.
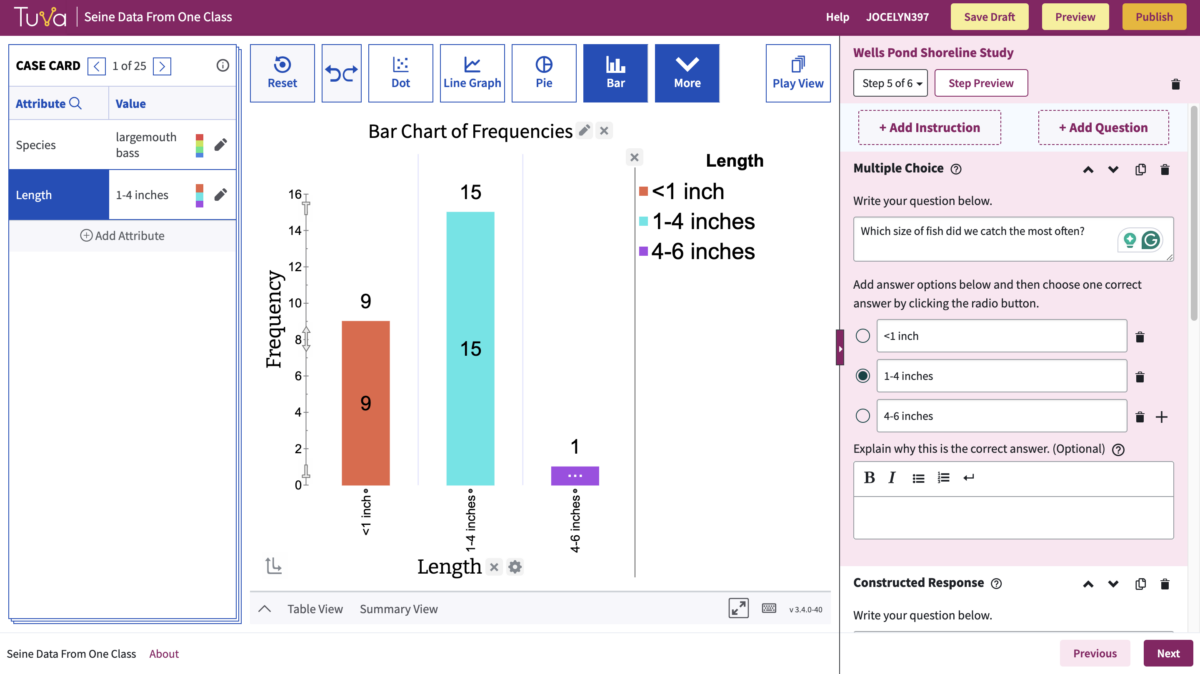
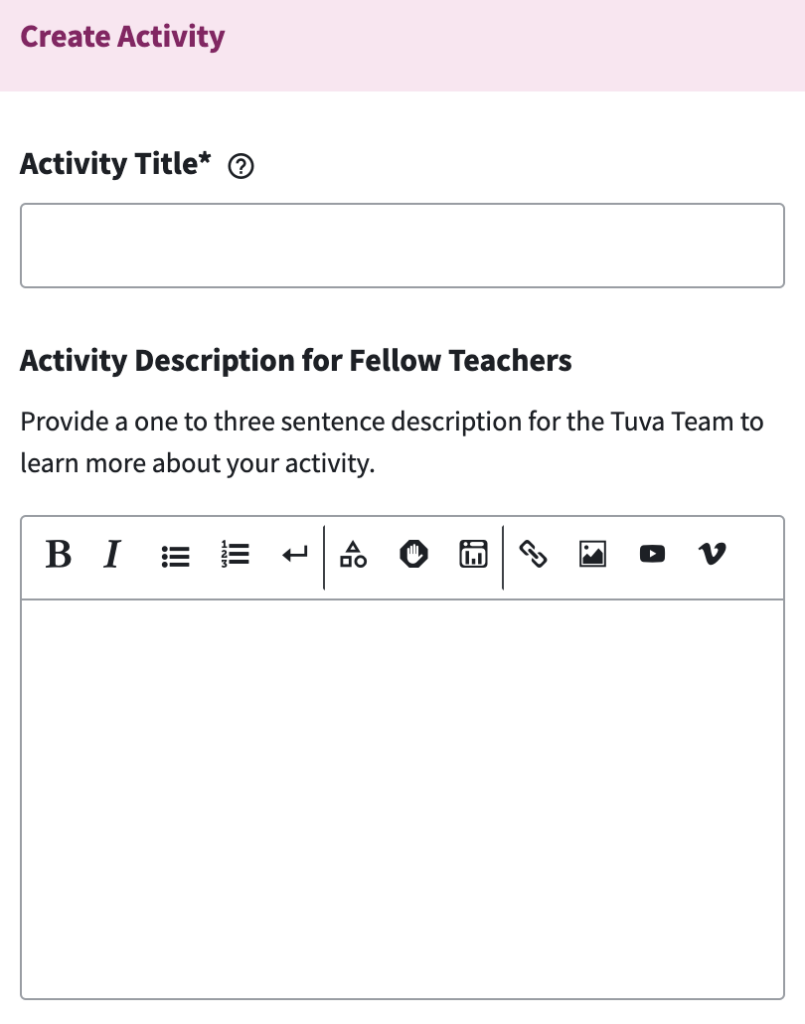
Select the Create Activity button in the lower right corner.
Create your activity.
Select Publish.
Choose one of the options: Publish Privately or Request Public Sharing.
Now, start sharing!
Sign Up for a (FREE) Private Tutorial
We’d be glad to show you how to use the Activity Builder. Sign up for a 30-minute office hours session to meet virtually with one of our educational specialists for a one-on-one tutorial.
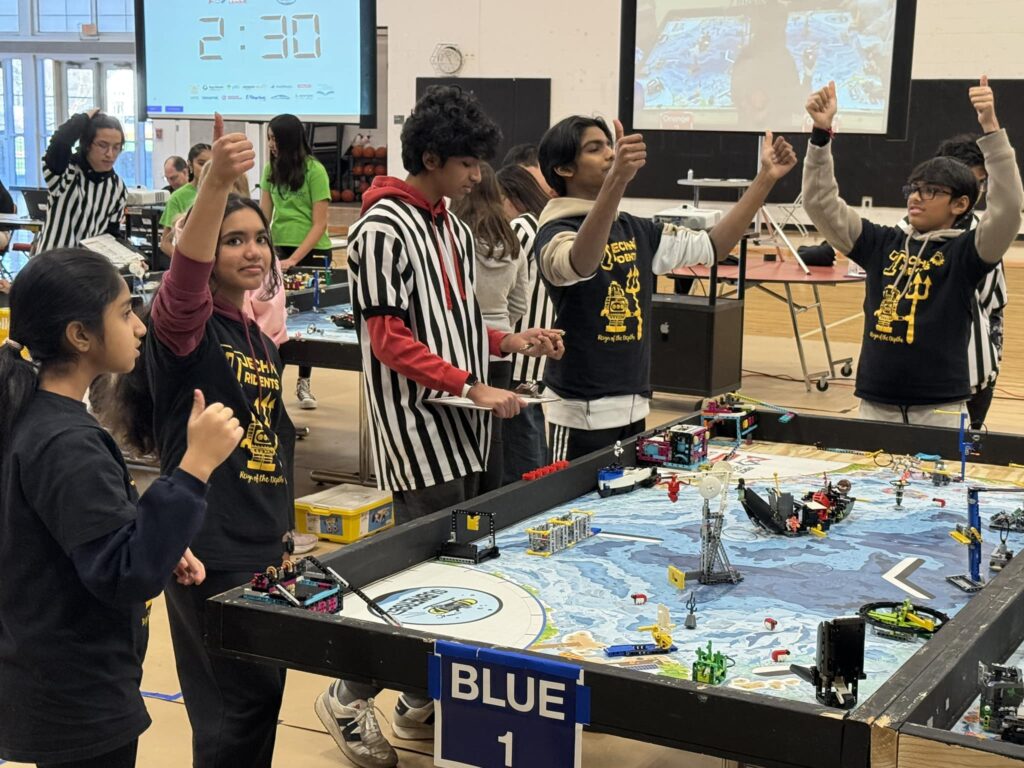
A team of ten Massachusetts 12- and 13-year olds want community members in the Narraganset Bay Watershed to change their behavior.
Their advice? Apply phosphorous-free fertilizers, use plantings to filter water, and convert impervious surfaces to absorbent ones. All of these changes, they say, will help prevent harmful algal blooms (HABs) in the bay.
The students reported, “Phosphorous, even in tiny amounts, can trigger HABs,”
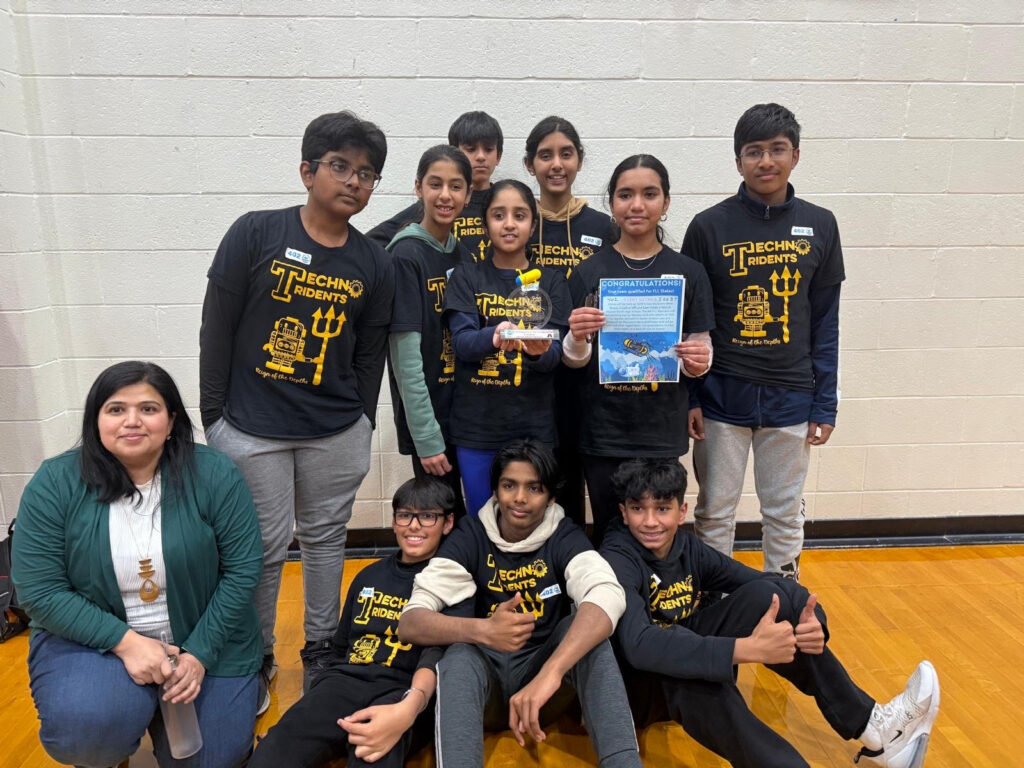
The youngsters, who call themselves The Techno Tridents, are all members of a robotics team from Eastern Massachusetts. They became concerned about the nearby estuary this fall when they began preparing for the 2024-25 FIRST LEGO League Challenge. The annual challenge always includes two major parts: designing a robot and conducting a research project. The research portion requires teams to identify a problem related to the year’s theme, find out as much as possible about the problem, and work out an innovative solution. This year’s challenge theme was “submerged” and centered around oceanography.
The Techno Tridents quickly became intrigued by HABs, particularly an infamous Narragansett Bay bloom in 2003 that resulted in massive fish kills and shellfish recalls. The team wanted to know what brings about these blooms.
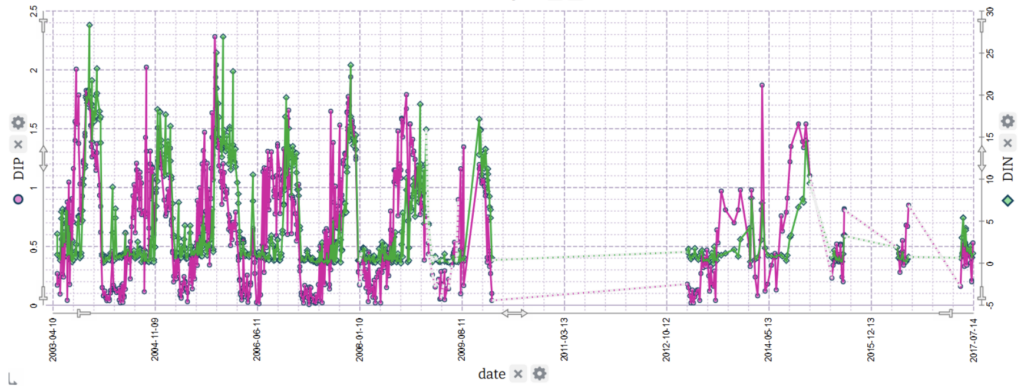
The first dataset The Techno Tridents used. Explore it in Tuva.
The dataset most helpful for their inquiry was about nutrient levels in Narragansett Bay and comprised 1,229 datapoints. It was marked “advanced- HS recommended.” The columns across the top of the spreadsheet simply listed date, depth, NH4, DIP, NO3 + NO2, NO3, NO2, and DIN. The problem? Many of the Techno Tridents had not yet completed a middle school chemistry unit let alone a high school chemistry class.
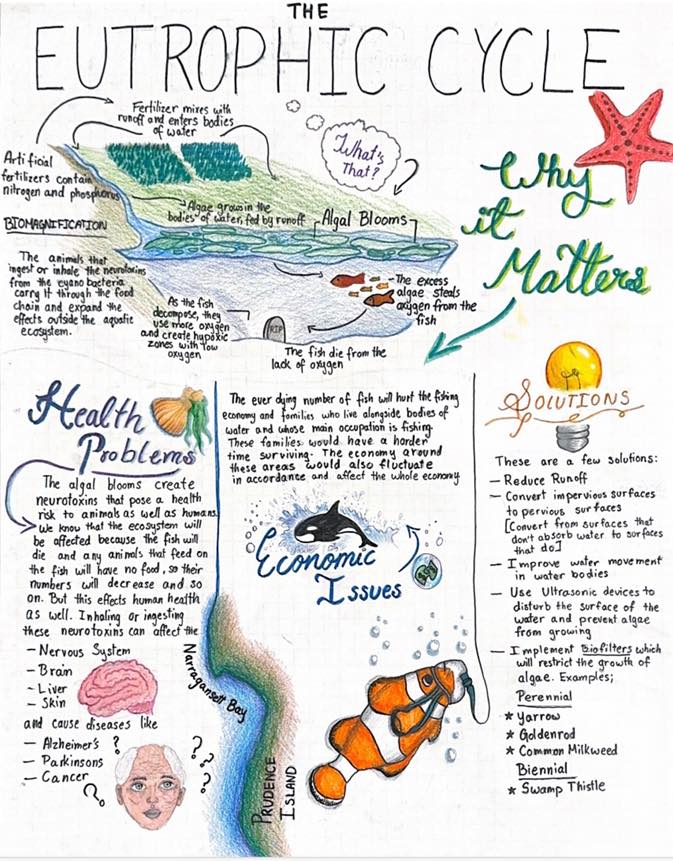
Poster created by 8th-grader Akshita Serikar,
To fully understand the data, the team needed to learn more about science concepts above their grade level such as the nitrogen cycle, the Periodic table, valency, ionization, pH, and eutrophication.
“There was a huge learning curve,” said Naravane. She laughed, admitting that, as an engineering teacher, she was included in that learning curve. “I just let them lead it,” she said.
Untangling the Data With Tuva
The students now faced the challenge of making sense of a complex, multivariate dataset. This is where Tuva became indispensable. The students uploaded the data provided by NES LTER into Tuva for analysis.
Naravane described Tuva as a “centerpiece” in helping her students uncover associations between variables. Using Tuva, students explored data analysis techniques. They learned how to add two variables on one axis, create dual-axis charts, and identify correlations. Tuva’s intuitive tools gave them insights that other software couldn’t match.
“Tuva labs is very sophisticated in the way that it allows you to see data,” Naravane said.
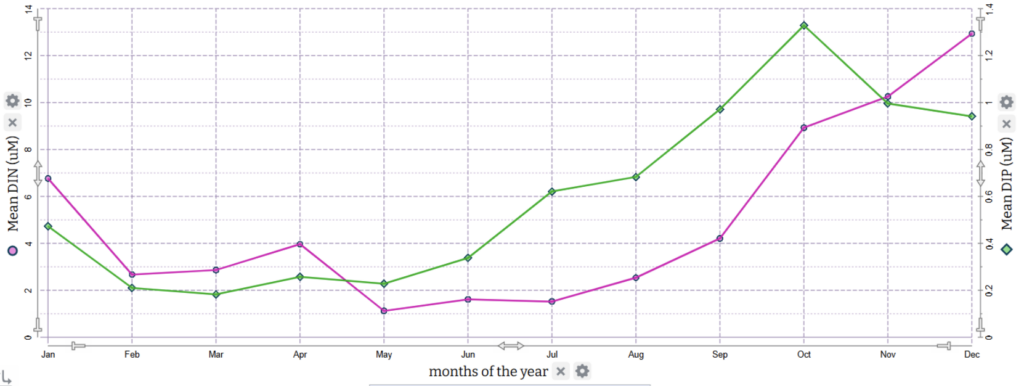
The story the data revealed was compelling: nutrient levels in Narragansett Bay spiked in October and November. Intrigued, the students sought to uncover the reasons behind this pattern.
The Techno Tridents included this graph in their project summary, writing, “The nitrogen and phosphorus spike in the fall… It is repetitive and we can see that the spikes are always more than 16uM of Nitrogen and 1.5uM of Phosphorus in October-November.“
To build a more complete picture, they explored additional attributes like temperature, rainfall, salinity, and occurrence of phytoplankton species. They discovered that October is when the water reaches its warmest temperatures and more rainfall occurs, contributing to increased runoff. This surge of nutrients, combined with peak temperatures, create ideal conditions for algal blooms.
Try using Tuva to look for relationships between sea surface temperature and phytoplankton.
Their analysis didn’t stop there. Using maps, the students noticed a high density of golf courses and lawns in the Narragansett Bay Watershed. Further research revealed that fall is a common time for lawn fertilization, adding another piece to the puzzle.
“We found a lot of these rabbit holes of science we could walk off into. And that’s exactly the kind of science learning I want,” Naravane said. “ You never get a chance to learn other things, unless you are powered by curiosity.”
Techno Tridents Secure Second Place With Data Analysis and Awareness Campaign
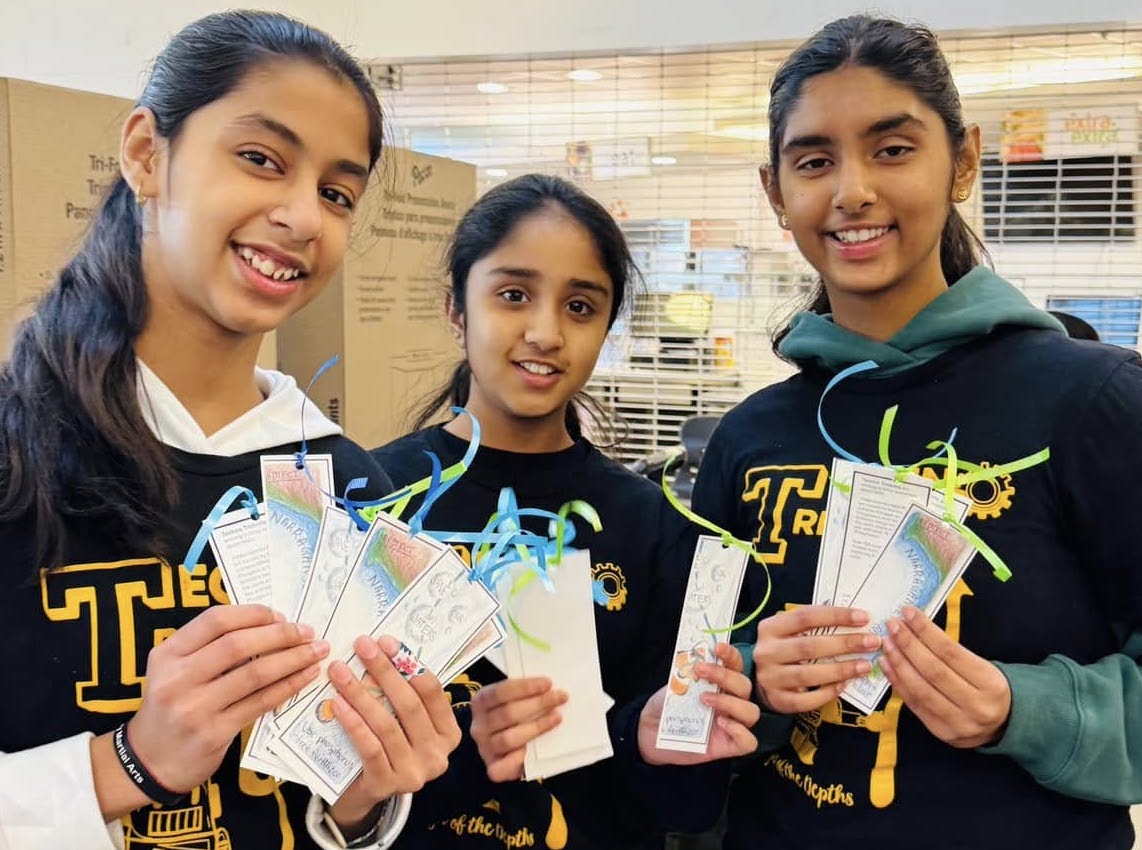
Based on all of the data, the students decided to launch a campaign to educate their community about responsible fertilization techniques. Their campaign included a variety of modes of communication: bookmarks with illustrations on one side and information on the reverse; an intricate, hand-drawn poster; and a Scratch animation.
Their data-backed campaign, along with their robot, helped the Techno Tridents land a second place finish in the Northborough FIRST LEGO League qualifier. Their work has also attracted the attention of other local organizations- including environmental non-profits looking to collaborate and a science-based art gallery that is going to display Serikar’s art (above).
Data’s Important Role in Innovation
Naravane coaches six teams via her small business Planet Robotics. Her work with students mainly centers around engineering. She is convinced that data needs to play a larger role in the engineering process.
“I really believe data is a new way to see things,” Naravane said. “If you don’t know what you are studying, how do you know it is a problem?”
Multilingual learners are the fastest-growing population of K-12 students in the U.S. Throughout the past six months, Tuva has taken a number of steps to ensure multilingual learners have access to rigorous STEM instruction.
1. Added a Keywords Feature
Academic language differs markedly from the language used in everyday social interactions. Fluency in conversational English doesn’t equate to academic fluency. That’s because social vocabulary is usually acquired within two years, whereas academic vocabulary can take up to 10.
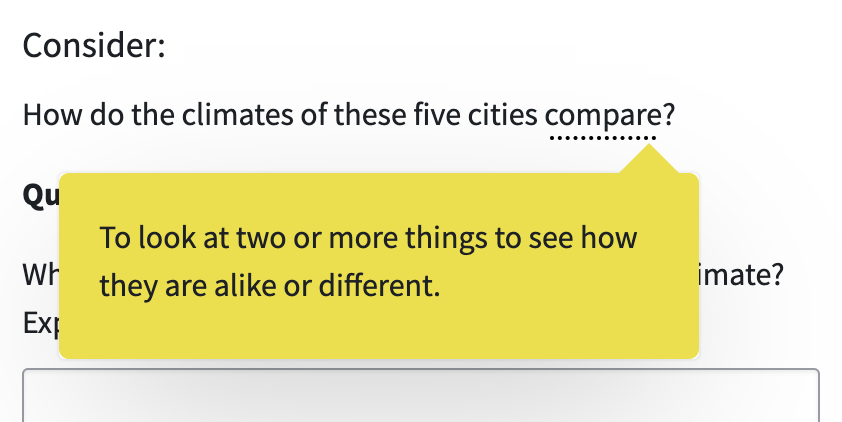
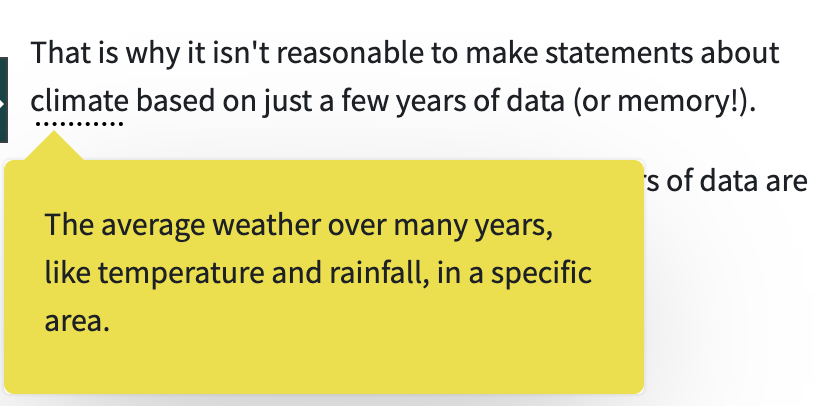
To support students as they develop academic vocabulary, Tuva has added a keywords feature. When students click on an underlined keyword, a definition will appear. These definitions are written at a 6th-grade reading level.
Many of Tuva’s keywords are tier two vocabulary words.
Tuva’s keyword feature defines terms not frequently heard in everyday conversation. This includes tier two vocabulary, academic language used across multiple subject areas (e.g. clarify, analyze,compare), and tier three vocabular, disciplinary-specific terminology (e.g. photosynthesis, velocity).
Other keywords are tier three vocabulary.
2. Authored WIDA-Aligned Lessons
Using the WIDA framework, we’ve begun weaving multiple English language development supports into our math and science lessons.
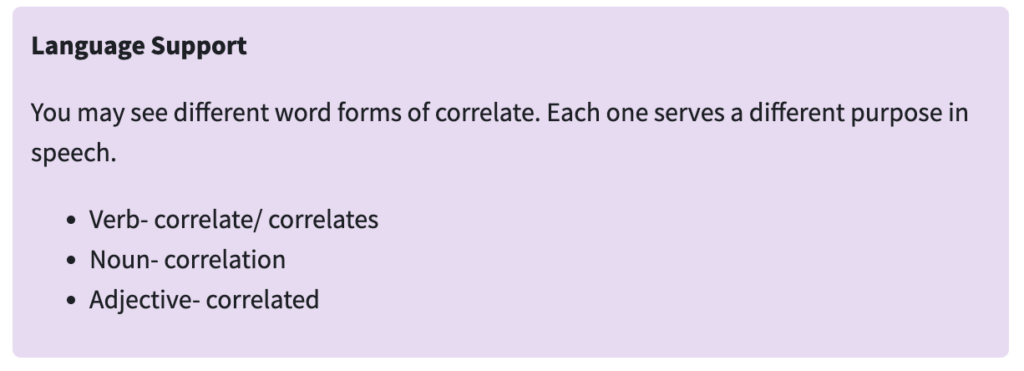
Language Support Tips
All learners, but especially multilingual learners, benefit from explicit instruction in academic language usage. Our newest lessons include language support tips such as sentence starters, instruction on parts of speech, or lists of helpful phrases for using data to inform, explain, or argue.
Prompt Discourse Conversation with peers helps multilingual students build a more nuanced understanding of STEM concepts. It also gives learners more opportunities to practice academic vocabulary and language.
We’ve made a concerted effort to promote discourse in any new full-length lessons and activities. By adding “Discussion” prompts to the lessons, we encourage students to discuss their thinking aloud.
Try One of Tuva’s New WIDA-Aligned Lessons
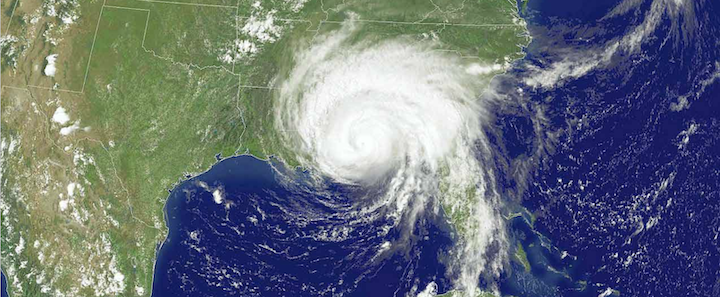
Elementary STEM: Preparing for a Hurricane
Secondary Math: Tackling Correlations
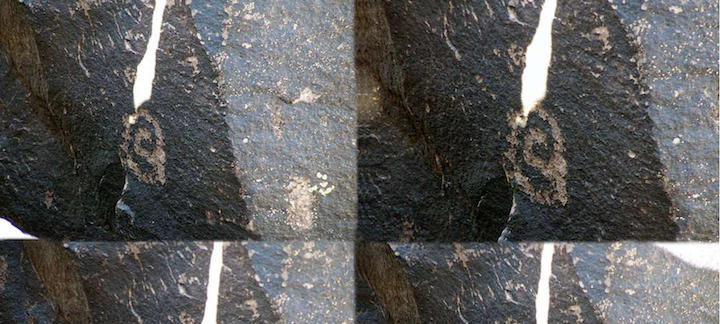
Secondary Science: Sun Seekers of Turtle Island
Check out our other lessons intentionally designed to support multilingual learners. View our secondary STEM lessons with ELD support or our elementary STEM lessons with ELD support.
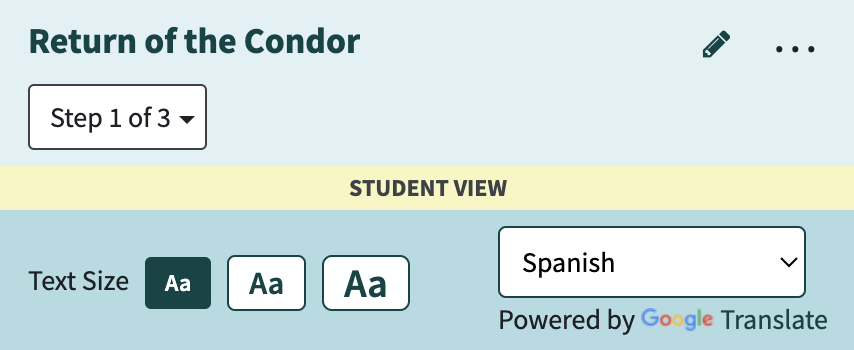
3. Enabled Easy Language Translation
Translanguaging boosts STEM comprehension. It also accelerates English language development. Thus, Tuva has prioritized making it easy for users to switch between languages in our lessons. Simply click the three dots in the upper right of the instruction panel to make the Google Translate widget appear.
Unique Approach Reveals Cross-Cultural Application of Mathematics
“The disconnect between the high school curriculum and students’ lives is all too common, particularly in math, and it frustrates me.”
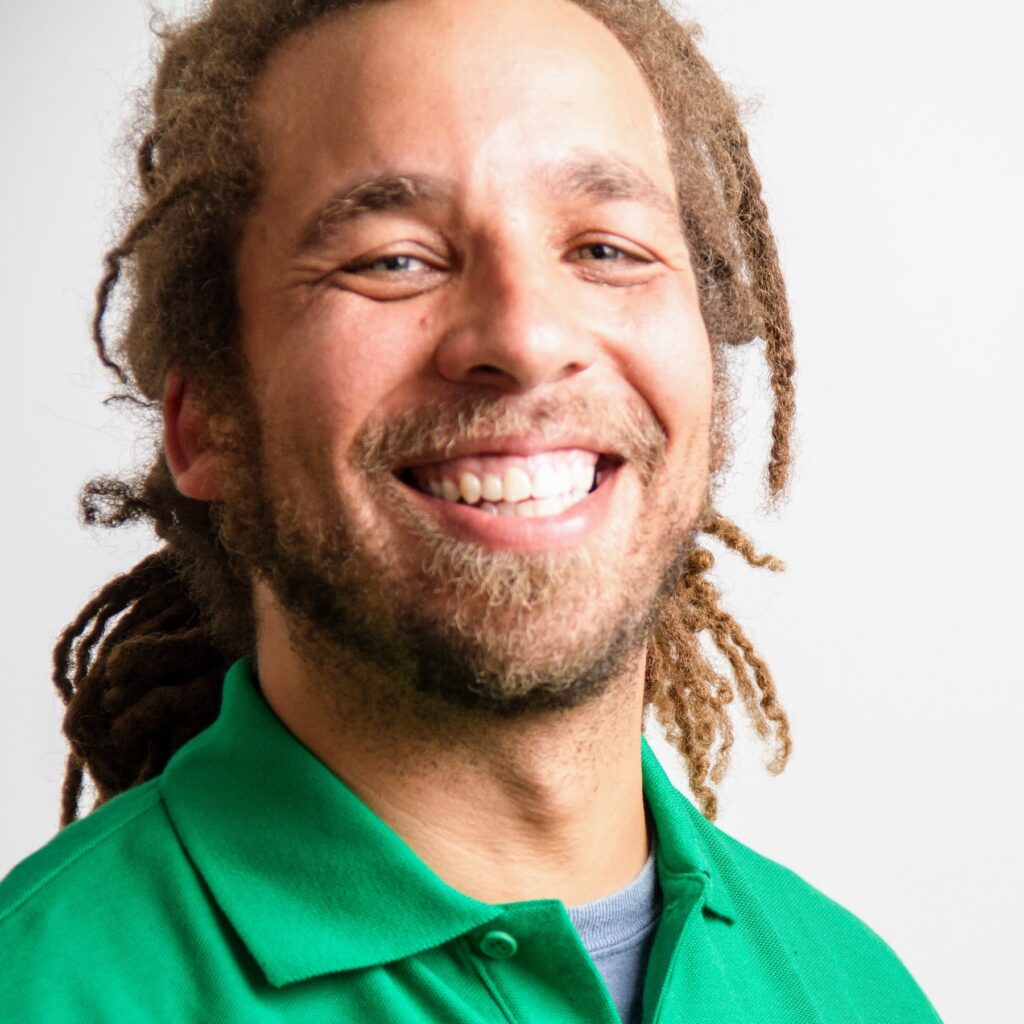
High school math teacher Gerald Smith is concerned about mathematics instruction in the United States.
Smith’s concerns are shared by others, including the National Council of Teachers of Mathematics. In a May 2024 position statement, the council expressed dissatisfaction with traditional modes of instruction which leave “students feeling a disconnect” and encouraged educators to humanize mathematics, to help students see math as a creative process of exploring and interacting with the world.
Smith has been teaching math for more than 20 years. He currently teaches pre-algebra and geometry at Indiana Area Senior High School in Indiana, Pennsylvania, and has been there for more than a decade. Previously, he taught abroad in Namibia and Eritrea.
In his efforts to help students see math as a vehicle for solving problems, Smith incorporates authentic applications from various cultures into his instruction. By using both local and international examples of mathematics applications, Smith helps students see math as something that is both universal and diverse. Tuva helps him do that.
Missing the Application for the Tools
“Math classes should be about how we use this tool of mathematics to understand the world around us,” explained Smith. “Many state and national exams focus too much on the tool itself, and not how it is used. It’s like being in a carpentry class, and only studying the power drill, not what you can do with it.”
“It’s like being in a carpentry class and only studying the power drill, not what you can do with it.”
This perspective is shared and elaborated upon further in the book Math is a Verb by professors Jim Barta, Ron Eglash, and Cathy Barkley. Their book challenges the perception of math as a set of static rules written in ancient times.
“Across the globe, people who would never be considered mathematicians are engaged with mathematical activities in the work they complete, the artifacts they construct, or the objects they design,” they counter. Furthermore, “mathematics is best understood as we experience its application within the cultures and contexts in which it is applied.”
Going Global
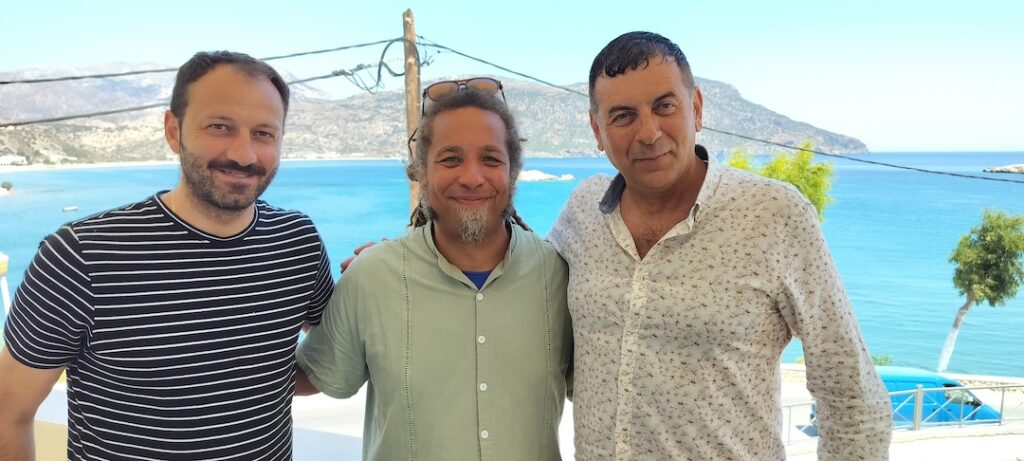
Smith with Karpathos municipal officials Vice Mayor Stathis Galafanakis (L) and civil engineer Jimmy Gorgatsoulis (R)
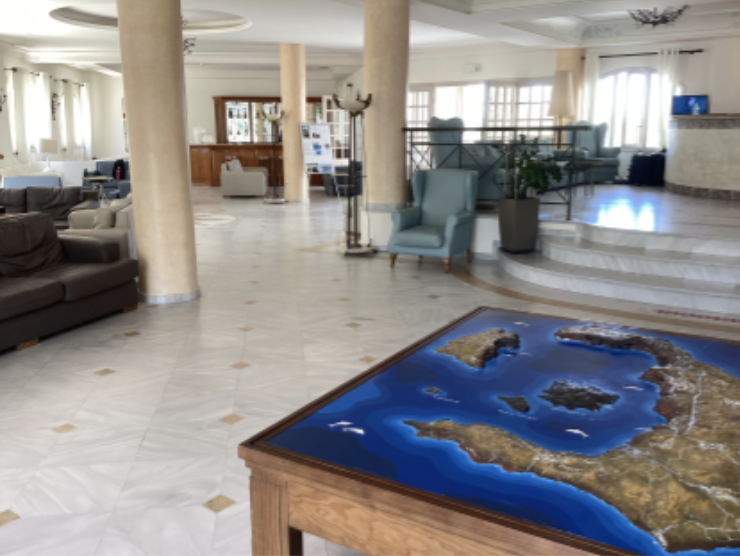
Smith’s most recent attempts to reveal mathematics as a living, breathing, multicultural discipline brought him to Greece. All teachers in his district are eligible for a partially paid sabbatical after their first 10 years of teaching. In anticipation, he applied for and was awarded a scholarship from the Fulbright Distinguished Awards in Teaching Research Program. Smith spent his six-month sabbatical gathering data in Greece and networking with educators and policymakers who live there.
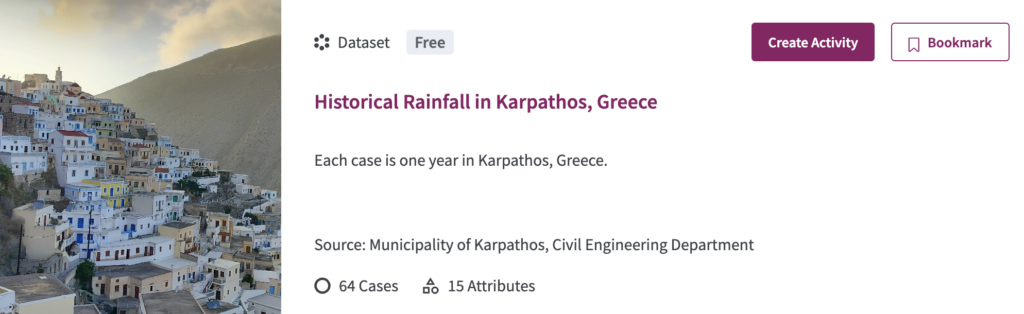
He returned with a collection of self-made lesson plans. The lessons simultaneously address key mathematical concepts and reveal how communities in Greece are applying math to solve real-world problems. Each of his lessons utilizes authentic data gathered from a municipality or other civic organization in Greece.
Using Linear Regression to Predict Water Supply
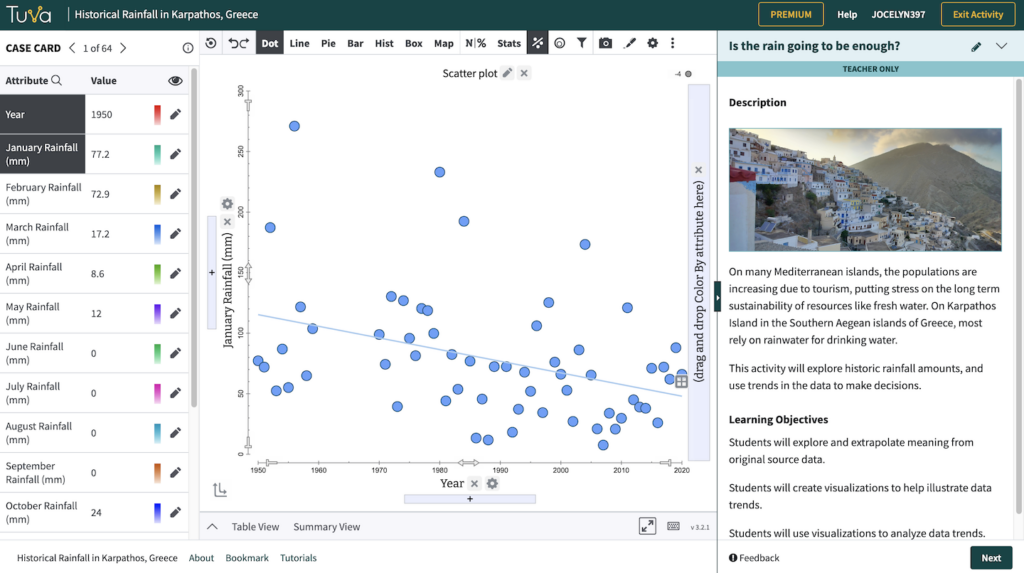
Smith has a blog called Mr. Smith’s Mathbox where you can read about his adventures in Greece and access his lesson materials. The link for Lesson 1 will bring you to Tuva and a lesson titled, “Is the rain going to be enough?”
Smith’s “Is the rain going to be enough?” lesson on Tuva.
The lesson confronts students with an issue facing municipal leaders on the island of Karpathos, Greece. Even as a long-anticipated reservoir is being built, rainfall is decreasing and population is increasing. They’re worried the supply of drinking water will not meet demand. Smith challenges students to use linear regression to model rainfall and population levels by 2030 and predict whether or not the reservoir will be adequate.
Finding the Right Tool
Real-world data can be hard to comprehend without the right scaffolding. Smith discovered the Tuva Tools when he was searching for a way to enable his students to actively and independently explore the datasets he’d gathered. He decided it would be a good fit for his project.
“The tool is so powerful, especially for kids who don’t identify themselves as data folks,” he explained.
Smith worked with Tuva to get his datasets added to the Dataset Library. Then, he used the Tuva Activity Builder to create his own lessons.
To create your own activities, find the cranberry-colored Create Activity button next to any dataset in Tuva’s Dataset Library.
Tuva’s Activity Builder enables users to create their own lessons based on datasets in Tuva’s Dataset Library. (Subscribers can create activities using any of the > 400 datasets in the library, and Basic users can create activities using any of the datasets marked “free”.)
Smith has integrated the Tuva tools into three of his other lessons as well. In “Island Hopping” students use data to make a recommendation to the Ios municipality on whether the island can support more swimming pools. (Below, explore the Ios dataset using the Tuva tools.)
Students note trends in how tourists are arriving and where they are lodging in Smith’s “Hypertourism” and “Sleeping in Santorini” lesson sequence. Then they use linear models to predict how many beds will be needed in basic vs. luxury accommodations in the coming years.
Best Understood Indeed
The common denominator in these lessons is context. If, as Barta et al. stated, “mathematics is best understood as we experience its application within the cultures and contexts in which it is applied,” Smith’s students will leave his class with a deeper comprehension of the underlying meaning of mathematics.
Want to Play?
Tinker with Smith’s four Greece datasets on Tuva for free until the end of November.
In July, California passed an updated Mathematics Curriculum Framework, which outlined major shifts in how the state expects schools and districts to approach math instruction. Our math team is excited about the new emphases of the framework and how Tuva is uniquely positioned to support them.
“We look forward to building on our ongoing substantial work with California educators to dedicatedly support the state’s math teachers, schools, and districts as they look to adapt and update their existing math instruction to teach data literacy and data science to their students,” says our co-founder, Harshil Parikh.
We’ve outlined below some of the major shifts and additions, and highlighted ways our work can support California math educators to be prepared for what’s to come.
Data Literacy and Data Science Emphasized
The California math framework is clear: data literacy and data science should be emphasized throughout the K-12 math ecosystem. In fact, the framework dedicates an entire chapter (Chapter 5) to Mathematical Foundations for Data Science.
“Students should have equitable access to data literacy and introductory data science at the K–12 level to facilitate equitable participation in a data-driven world as adults.” (Chapter 5, Page 5)
The chapter lays out how data science fits into each grade band, as well as thematic topics within the California CCSS-M that directly support data science. Topics like: understanding variability, the data collection process, and comparing and finding associations between variables.
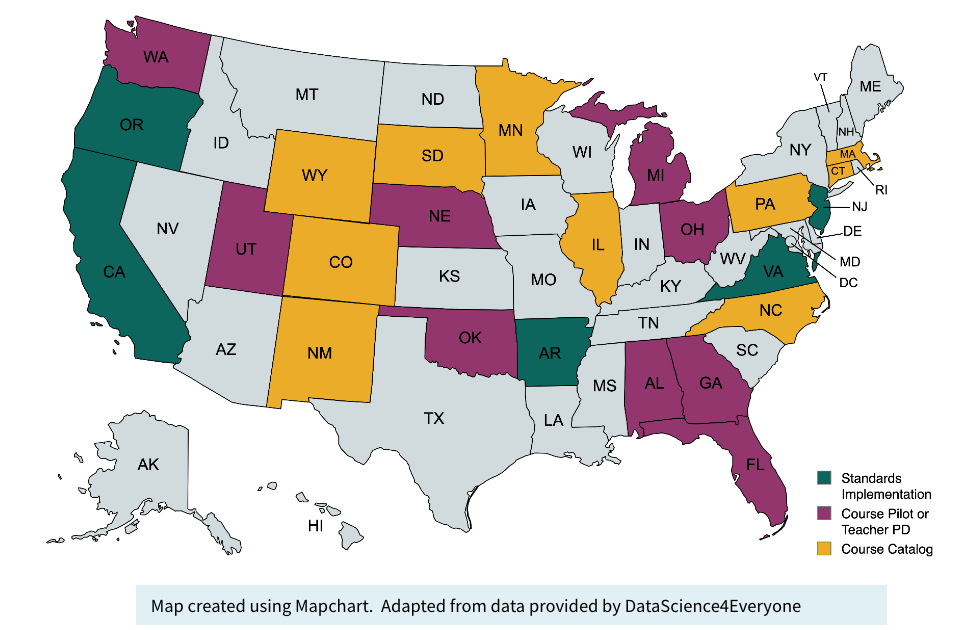
As an organization founded on the belief that data literacy skills are crucial for students’ success in school and beyond, we’re excited to see California join a growing number of states in recognizing the importance of data literacy and data science throughout the K-12 pipeline.
We also know that teaching data literacy skills can be daunting. To support teachers in understanding where their students should be in their data literacy skill-progression across grade bands, we’ve developed a comprehensive data literacy framework that outlines the major skill areas students should progress through as they deepen their data literacy skills.
Data is a Vehicle Through Which Math Content is Applied
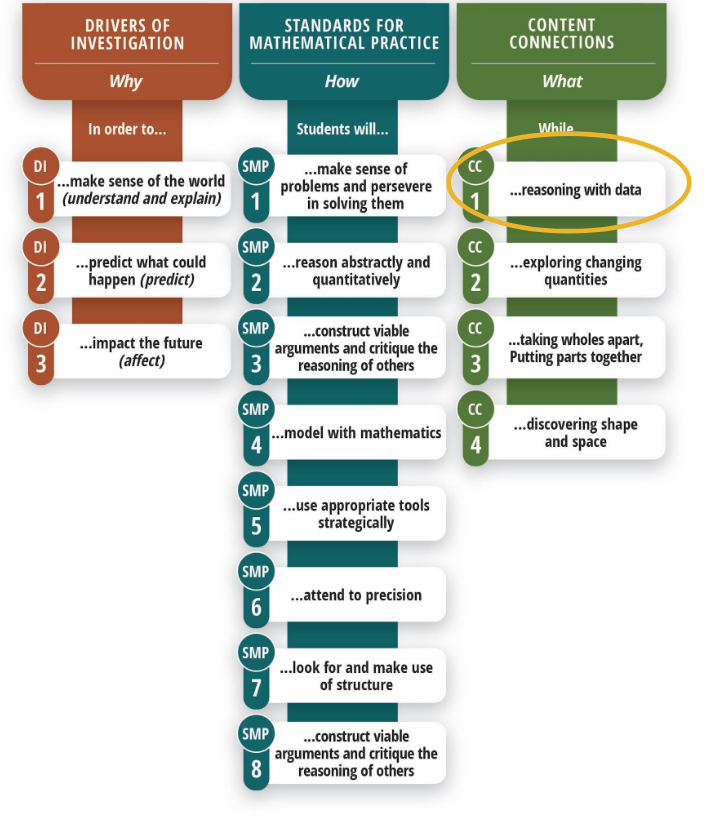
In this iteration of the framework, California has introduced Content Connections, which “embody the understandings, skills, and dispositions expected of high school graduates (Chapter 1, Page 22).”
You can think of these content connections as the vehicle through which students are applying their understanding of the standards. So, for example, if a sixth-grade student is learning about fraction relationships, one of the ways they may apply their knowledge is by reasoning with data.
At Tuva, this is already how we approach the development of math content. We see data as a way for students to both learn and apply their mathematical knowledge, while hopefully engaging with a context that is fun and relatable.
For example, in our 6th-grade activity Analyzing Dinosaurs with Fractions and Percentages, students use their understanding of part-to-whole relationships to analyze an interesting dataset on 28 commonly known dinosaurs, and ultimately make claims about the types of dinosaurs that existed across geological periods.
Moving From Clusters to Big Ideas
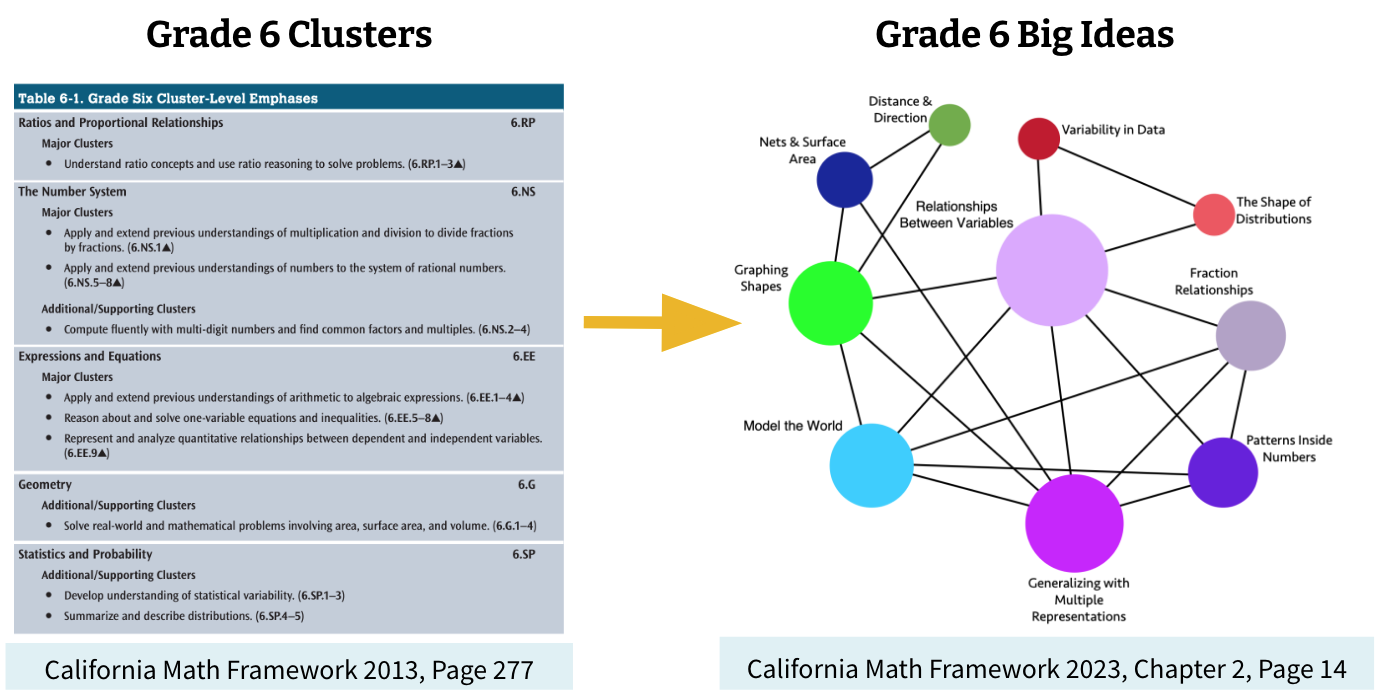
While the framework didn’t change the actual language of the standards (California continues to use the California Common Core State Standards for Mathematics), it did outline a reorganization of the standards around “Big Ideas” rather than the previously used “Clusters”.
Like most states that use the Common Core, California previously identified major grade-level clusters, which served as a way for educators and curriculum providers to identify the most important standards within a course. Those same priority standards are still identified via the size of each concept bubble in the course’s big ideas map (shown below).
While the big ideas maps for each grade level may at first look intimidating, they serve a pedagogical purpose: to help both learners and teachers of mathematics come to view math as a series of interconnected concepts that spiral across grade levels.
“Standards and textbooks tend to divide the subject into smaller topics, but it is important for teachers and students at each grade level to think about the big mathematical ideas and the connections between them .” (Chapter 2, Page 12)
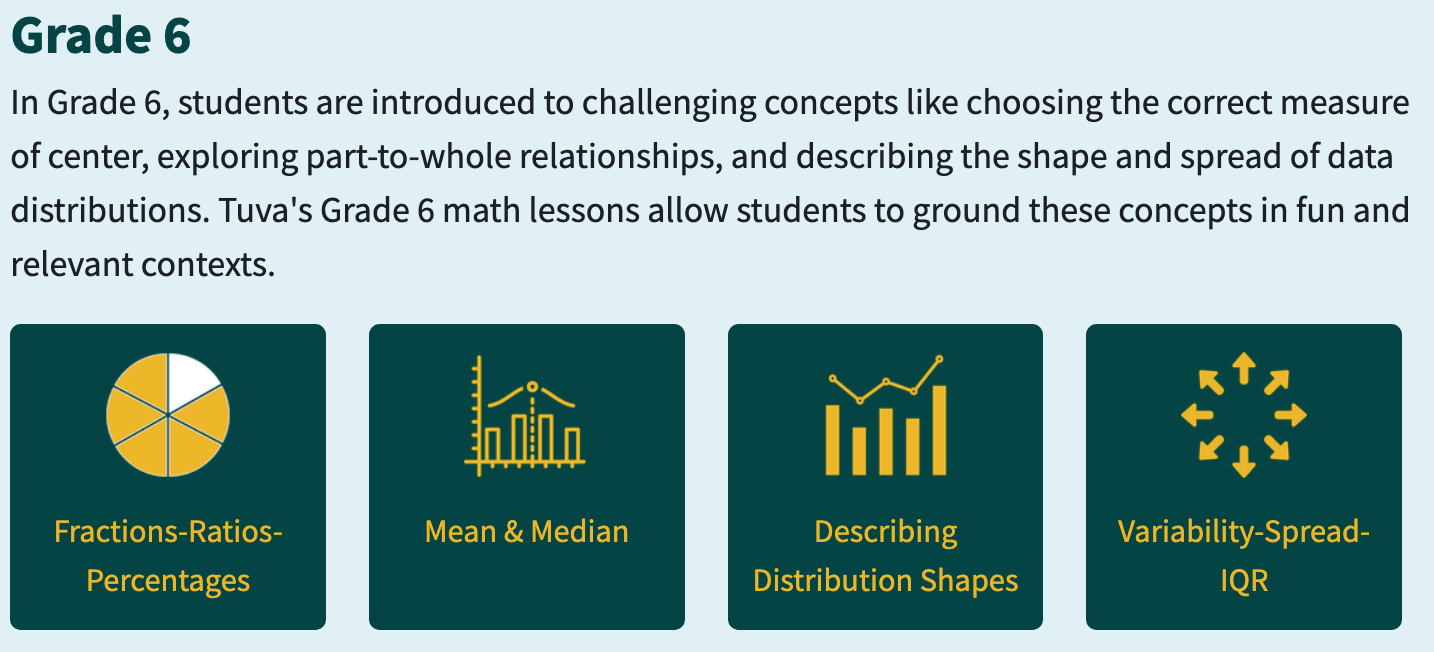
Here at Tuva, we recently reorganized our math content library to focus on the big ideas of each grade level – specifically those which have strong potential for data applications.
The design of our new math library is intended to help teachers see the connections between content standards in their course and find rigorous data investigations that can support students’ conceptual understanding of the topic. Our content library buckets are intended to encompass multiple standards and will naturally have some conceptual overlap. Learn more about our reorganization in our recent blog post.
Student Engagement is Coequal With Content Mastery
The California framework makes it clear that student engagement in math is just as important as student mastery of content standards:
“When students are engaged in meaningful, investigative experiences, they can come to view mathematics, and their own relationship to mathematics, far more positively. By contrast, when students sit in rows watching a teacher demonstrate methods before reproducing them in short exercise questions unconnected to real data or situations, the result can be mathematical disinterest or the perpetuation of the common perspective that mathematics is merely a sterile set of rules.” (Chapter 2, Page 9)
If you’re familiar with Tuva and our vision for math and science education, this sentiment will feel very similar to our vision statement:
“Tuva envisions a world where every student experiences the joy of learning math and science through real-world contexts. We imagine a future in which all students possess data literacy and use it to contribute positively to society.”
And this isn’t just an empty vision statement; our teachers are already exemplifying the possibilities of teaching mathematics in this way. Read our previous posts about math teachers like Chad Boger and Annie Pettit who are making the learning personal and relevant for their students using Tuva tools and datasets.
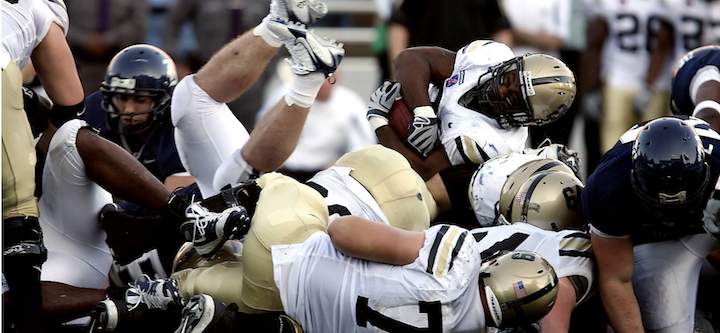
Get Started Using Data in Your Math Instruction
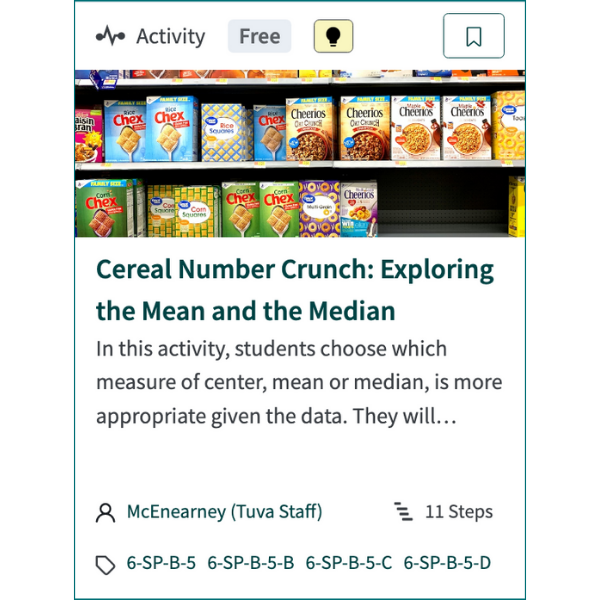
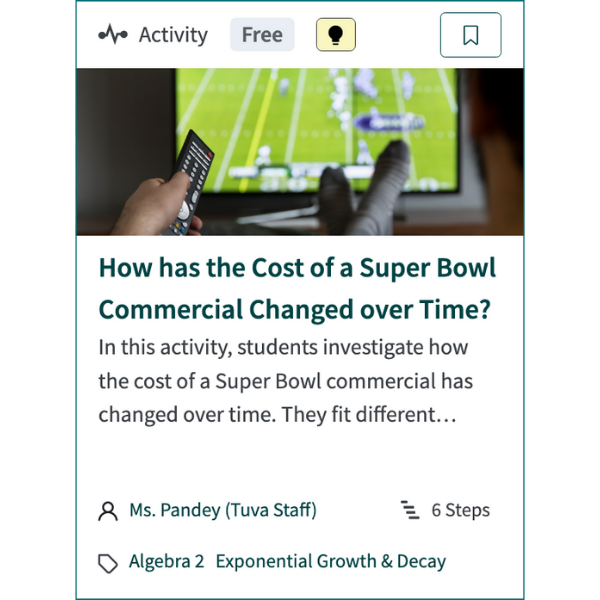
If you’re looking for a place to get started integrating data into your math instruction, we have a few suggestions. This free middle school lesson on choosing the correct measure of center hooks students through an exploration of popular breakfast cereals and their nutritional content. For high school applications, try out this free lesson exploring the exponential growth of the cost of Super Bowl commercials over the years.