Nate Sebold Champions Authentic Data to Surface Social Justice Issues and Boost Inclusion

One of the things Putney, Vermont, teacher Nate Sebold loves about middle school students is that they are full of questions. He considers it his job to “harness” those questions and give kids the tools they need to answer them. For Sebold, that means having students interact with data.
“How to interpret data, how to question data sources, how to investigate data – these are increasingly important for today’s 13-year olds. Data is going to be such a huge part of their lives,” said Sebold.
According to Sebold, contrived data won’t cut it. He prefers to use real-world data. His reasons are twofold: social justice and classroom inclusivity.
Surfacing Social Justice Issues with Data
Sebold experienced an aha moment at a National Council of Teachers of Mathematics conference. The presenter pointed out that teachers make a choice when they place a graph in front of students. The graph can be about something socially relevant, or not. Since then Sebold selects data carefully with an eye to surfacing important social justice issues. For example, Sebold regularly uses the Tuva activity Incomes of Men and Women in the US: Comparing Groups with Box Plots. Sebold said that introducing relevant data, like this dataset, in the classroom creates a space for students to ask questions and increases classroom dialogue.
Boosting Inclusion by Helping Student Connect Personally to Data
Another advantage of real-world data, Sebold said, is that it benefits students with learning differences.
Before taking the job at Putney Central School in 2022, Sebold spent a number of years as math department head at the Greenwood School, a small college preparatory school for students with learning differences. He and his science colleague noticed a real difference in conceptual understanding of data when students had collected it themselves.
“When they would sort it… they would say, ‘there’s my point in the midst of all the others!’ The data meant something.”
Sebold explained that when students saw that the graphs were not just randomly created, but made up of points of data they had collected, it helped them comprehend that all graphs are made up of individual data points. Data visualizations became more concrete.
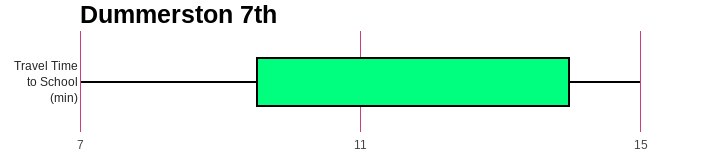
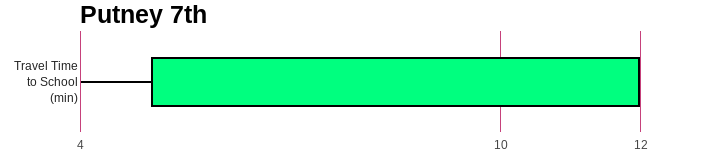
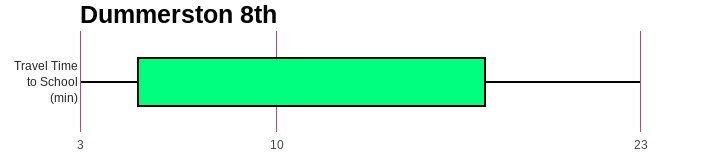
In one project, Sebold’s students entered their own demographic data into Tuva. Sebold notes students’ comprehension of graphs increases when they help with the data collection process.
“When we pulled the data up on Tuva, they would try to find their own response, their data point. Then, when they would sort it or organize it, they would say, ‘there’s my point in the midst of all the others!’ The data meant something,” Sebold said.
Inspired? Surface social justice with these resources.