As a teenager, Christine Adamson thought science was only for the few who could survive. “It felt like a weed-out type of class,” she recalls, “like it was supposed to be so hard that only a few people would be good at it.”
Now a science teacher at Day Middle School in Newton, Mass., Adamson is determined to change that narrative. “I want my students to walk away with this idea that a scientist can be anyone,” she says.
One way Adamson does that is through the Northeast U.S. Shelf Long-term Ecological Research (NES-LTER) Data Jam, a competition where students work with real ecological data and professional scientists.
Telling a Story About Data
This Data Jam challenges students to bring real data to life through creative storytelling. The word “data” might make some people’s eyes glaze over, but this project is anything but boring. Think crustacean costumes, video games, and illustrated storybooks.
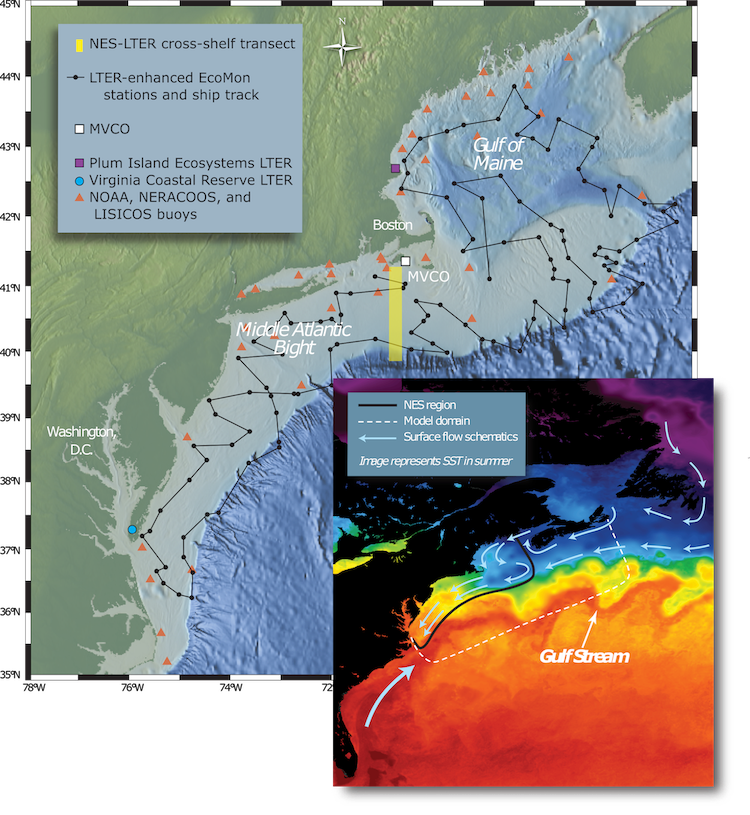
All of the data comes from research conducted as part of the Northeast U.S. Shelf Long-Term Ecological Research (NES-LTER) Program. NES-LTER scientists collaborate to gather oceanographic data about the continental shelf over an extended period. To be eligible for National Science Foundation funding, LTER sites must include a broader impacts component.
Because K-12 students can’t easily join marine research trips, NES-LTER’s Education Coordinator Annette Brickley launched the Data Jam seven years ago. She selects teen-friendly datasets from recent studies and challenges students to tell a story using any expressive medium.
Tuva Helps Students Find The Story, Boosts Confidence
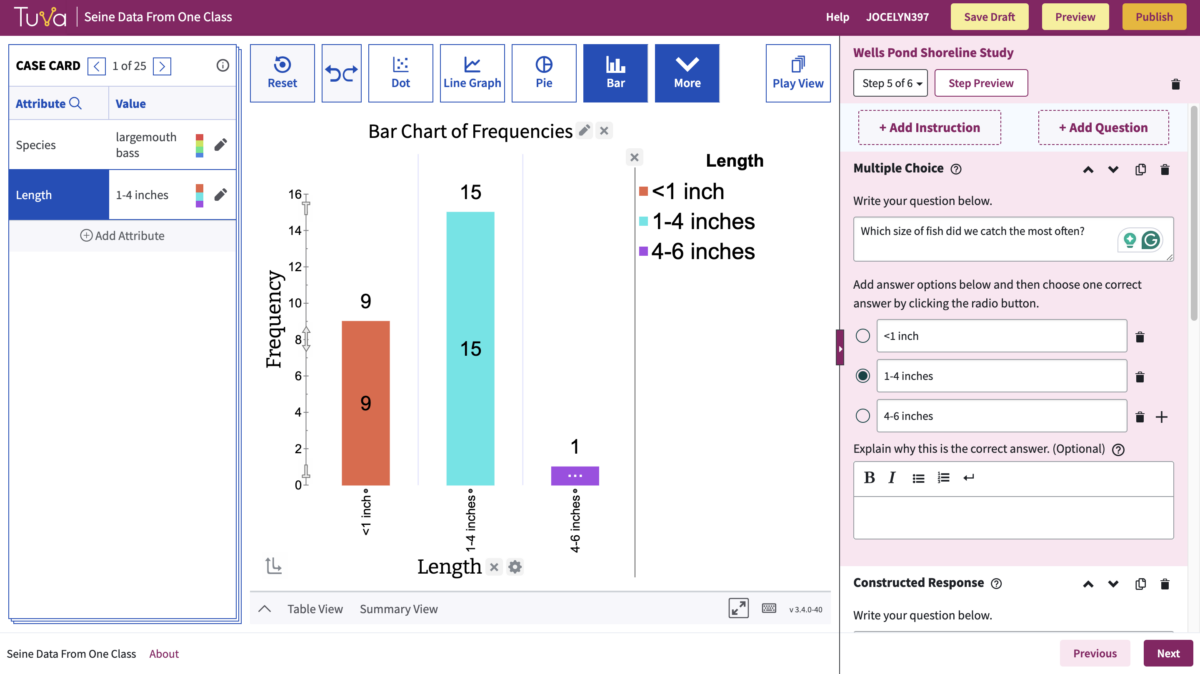
The first step of the competition is finding the story within the data. Adamson, like 90% of Data Jam participants, relies on Tuva for this phase.
Adamson recalled the first time Brickley showed her Tuva: “She’s showing us how she uploads the data. All of a sudden this graph populates, and you could just pull over the variables. This is amazing, right? And even the kids were like, ‘Wow!’”
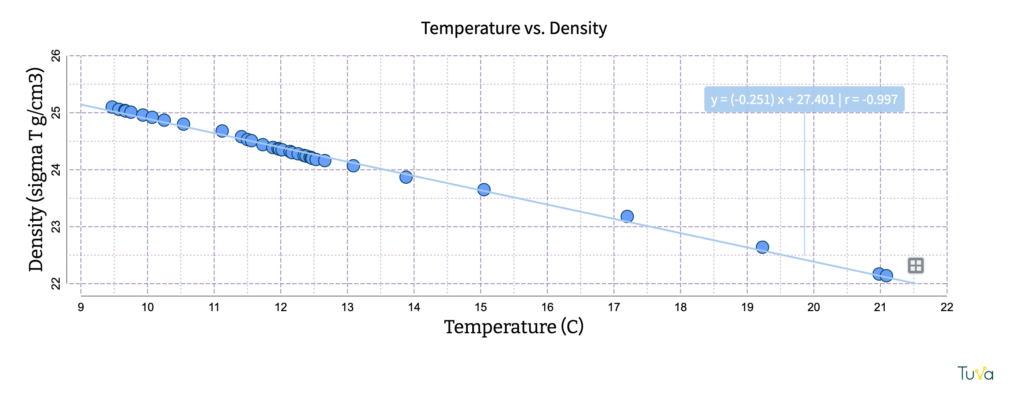
The drag-and-drop interface helped students quickly make sense of the variables and the associations between them.
Adamson noted that Tuva also accomplished something deeper—it boosted students’ confidence. They were proud of the professional-looking visualizations they were able to create. For Adamson, that confidence is essential.
“I like having them feel successful in class,” she said. “So that if science is something they’re interested in, they feel like they can do science.”
In Adamson’s classroom, success breeds success and opens the door to students seeing themselves as scientists.
Real Data + Creative Outlet = Student Investment
Once students have used Tuva to identify interesting patterns or trends in the data, they unleash their creativity to tell the story. In past years, Adamson’s students have composed symphonies, developed elaborate board games, and recorded songs.
“The kids who are, during the year, maybe not as engaged— they just light up with this project,” said Adamson.
She quickly rattled off three examples: a group so engrossed in writing their rap about fish that they didn’t want to stop for lunch, a quiet student who found her voice narrating a group video, and a chronically absent student who started showing up every day during the project—and kept coming even after it ended.
But Adamson believes it’s not just the creativity that draws students in—it’s also the sense that they’re contributing to something larger.
“It’s not just a standalone lesson,” she said. “It’s connected to something real. They feel a lot more ownership over it than just doing regular classwork.”
NES-LTER scientists serve as judges, offering feedback to every group. For many students, this is a powerful moment: real scientists, from diverse backgrounds, are not only evaluating their work but engaging with it, showing that science is a community they can be part of.
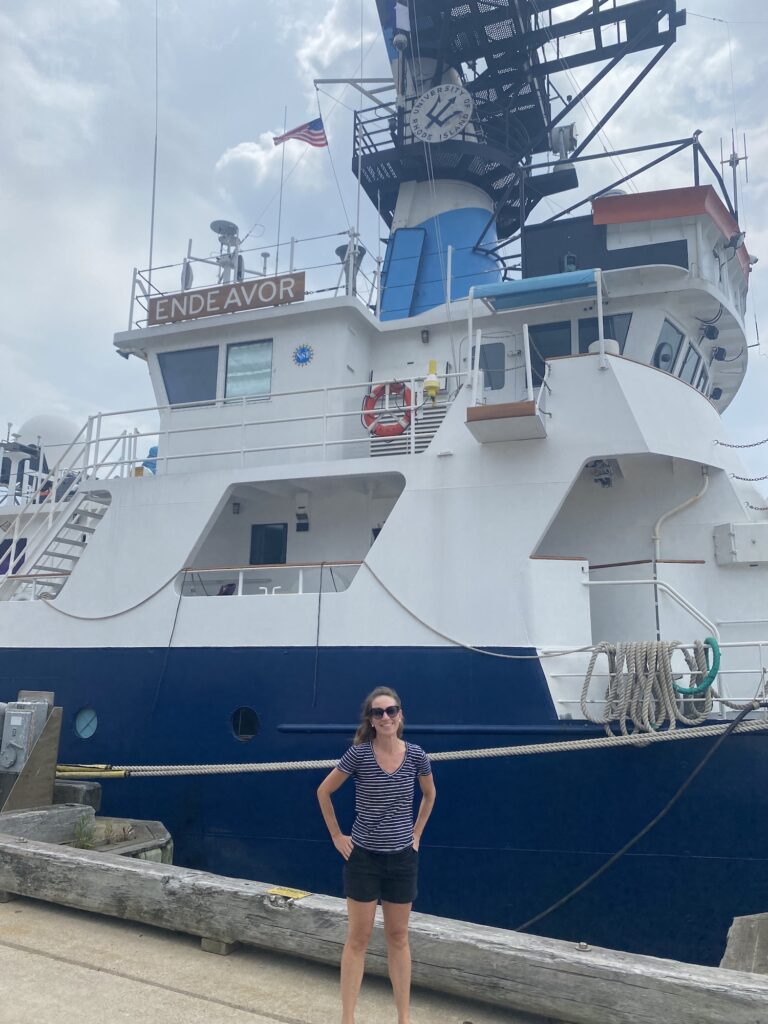
That insight deepened after Adamson’s own experience aboard a research vessel, where she spoke with working NES-LTER scientists about what spurred them to pursue a career in science and how to interest more students.
The answer that stuck with her: show students how the data they’re working with might lead to real, positive impact. When students understand that their work matters—that it’s part of something bigger—they’re more likely to see themselves in the role of scientist.
This Year’s Contest
This year’s submissions are due in early June. While most participants are in Massachusetts and Rhode Island, the NES-LTER Data Jam is open to U.S. classrooms nationwide.
The official registration deadline has passed, but educators can still join by emailing Annette Brickley directly at abrickley.edu@gmail.com.
Make Your Students into Data Storytellers!
No matter where you are or what ecological concept you are studying, you can take a page from the Data Jam playbook. Find some real-world data, use Tuva to identify the story, then let your kids get creative in its telling.
Here’s how to find authentic data:
- Find a classroom-ready dataset in Tuva’s Dataset Library. All of our datasets are generated from real-world data. (Some, like the Giant Kelp Growth dataset and Long Term Temperature and Precipitation, come directly from LTER sites.)
- Upload data from an LTER study into Tuva. (Sign up for office hours if you need help.)
- Upload data from governmental sources, such as NOAA, NASA, or Data.gov, into Tuva.