Real-world pedagogy and data literacy are at the heart of Tuva’s mission. Today, we are advancing that work further by enabling you to create custom activities in Tuva using your own data.
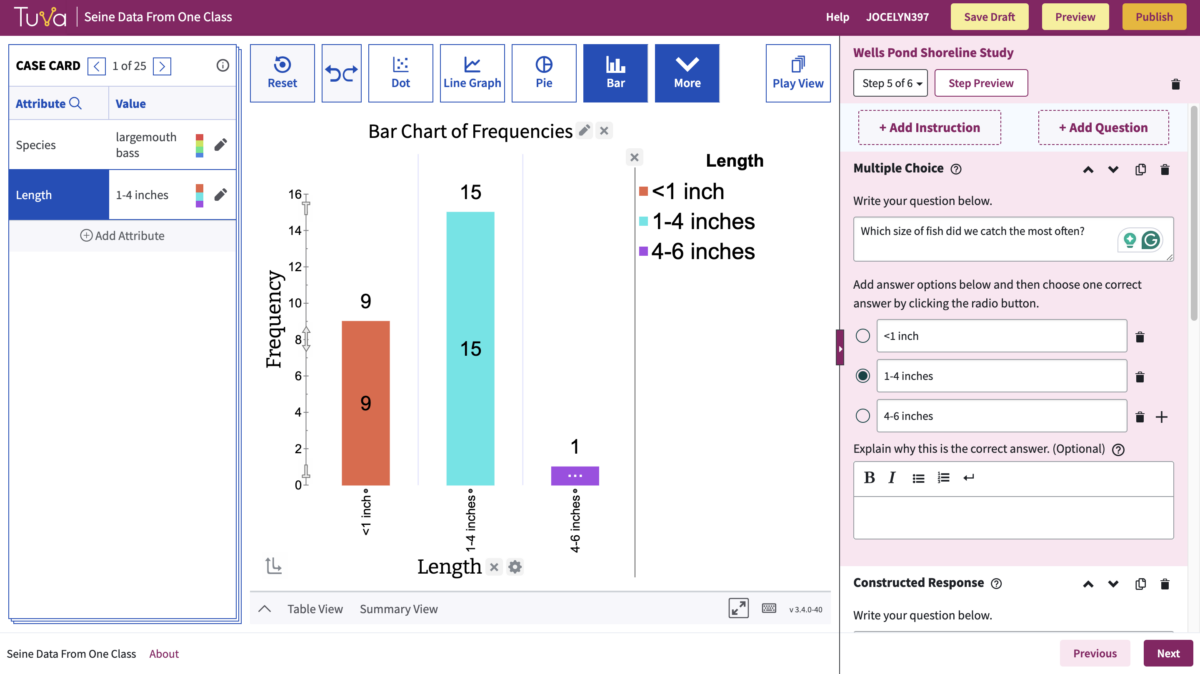
The Tuva Activity Builder allows you to place your best lesson ideas beside our powerful, accessible data visualization tools. That means the ability to quickly explore data and create, revise, and analyze graphs will be right at your students’ fingertips.
Five Reasons to Take Advantage of Tuva’s New Activity Builder
1. Strengthen Connection, Deepen Comprehension

Collect data with your students one day, then incorporate their dataset into a lesson on Tuva for the following day. Students will have a deeper connection to and comprehension of the data when they’ve collected it personally.
This deep involvement in the entire science process–from collection to sophisticated visualization and analysis–helps students see themselves as scientists, not just people learning about science.
2. You Pick the Phenomena, We Provide the Tools
Your creativity far exceeds the bounds of our Science Content Library; we simply cannot encompass every possible anchoring phenomenon. The ability to craft lessons in Tuva from your own datasets allows you to stick closely to your anchor phenomenon without sacrificing the benefits afforded by the Tuva tools.
3. Create Lessons That Speak to Your Students

Relevance drives student engagement. Use local data to center your math or science lessons around places familiar to your students. Alternatively, capitalize on your students’ unique personalities by pulling in data about topics you know interest them.
4. Make Graphing Accessible to All Learners
Our tools are designed to be accessible for learners with diverse abilities. So, when you create your lesson in Tuva you can rest assured all students will be able to engage meaningfully with data. (Learn more about Tuva’s Commitment to Accessibility.)

5. Strut Your Stuff and Help Make the Future #DataLit
You’re brilliant. Your work should be shared. You can now enable school colleagues and far-flung teacher friends to use more data in their instructional practice by sharing a direct link to your original lessons in Tuva. (And while you’re at it, remind them to hit you back. It’s a team effort.)
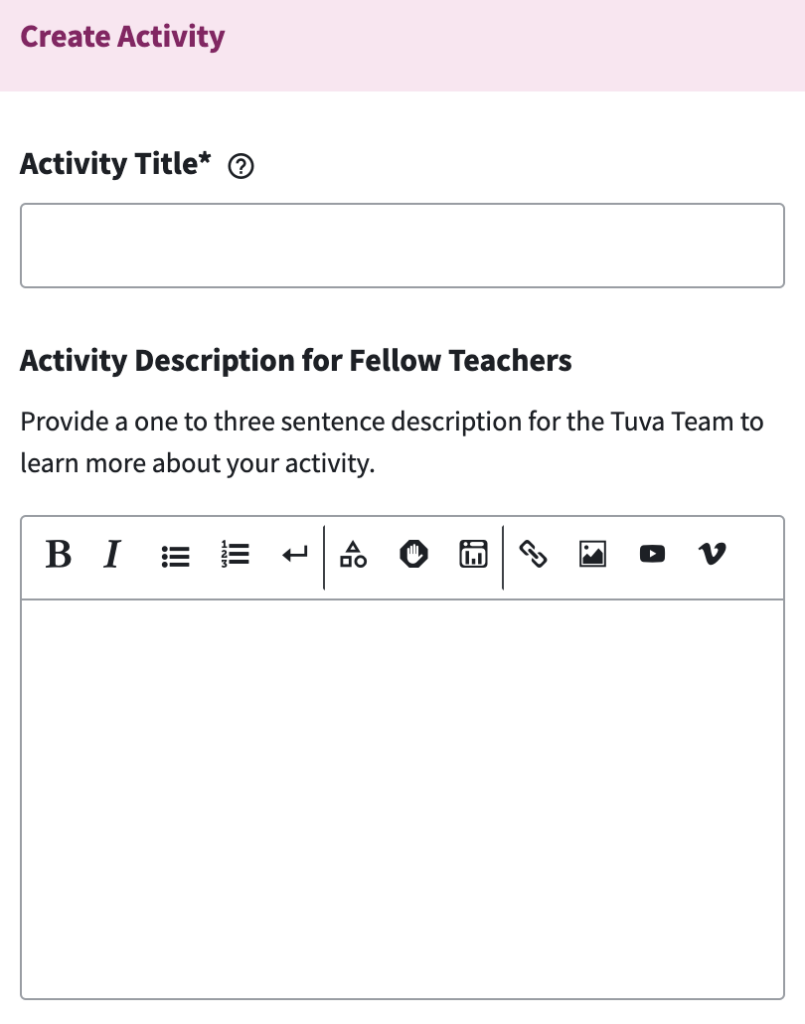
How to Get Started Building Lessons
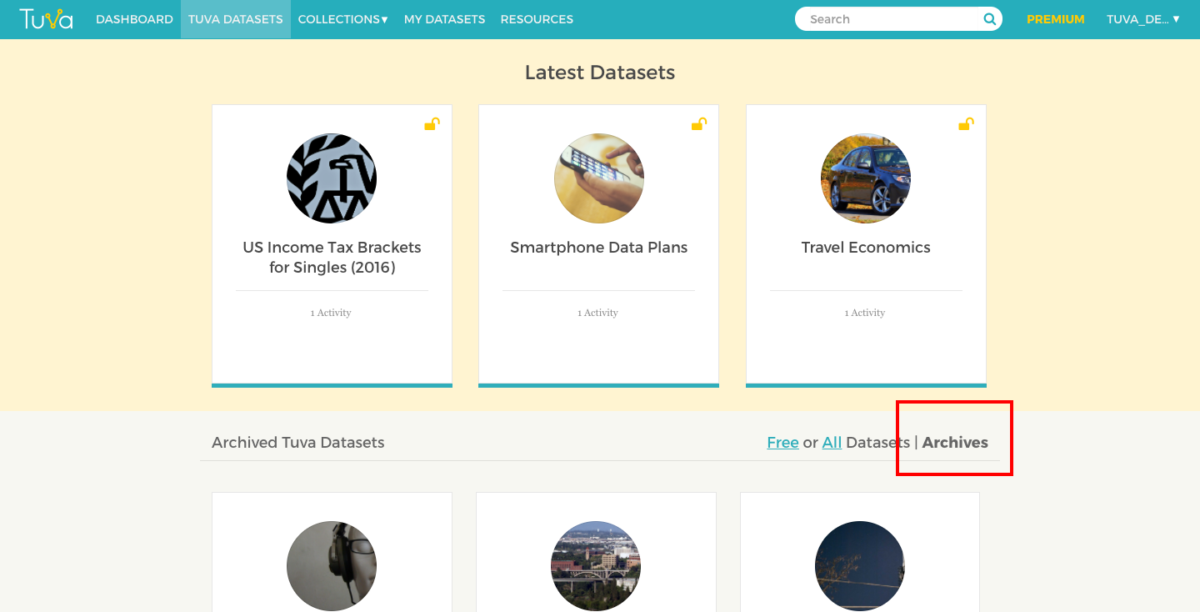
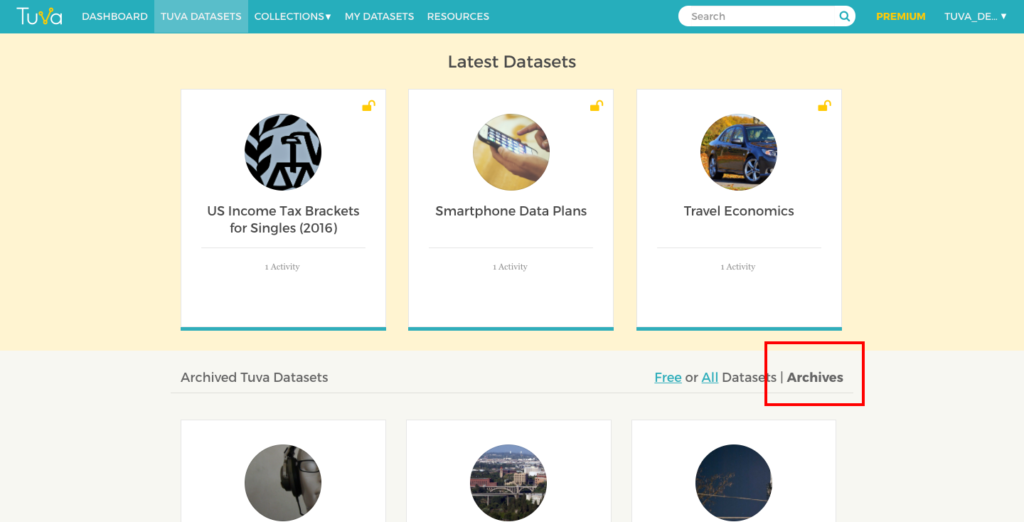
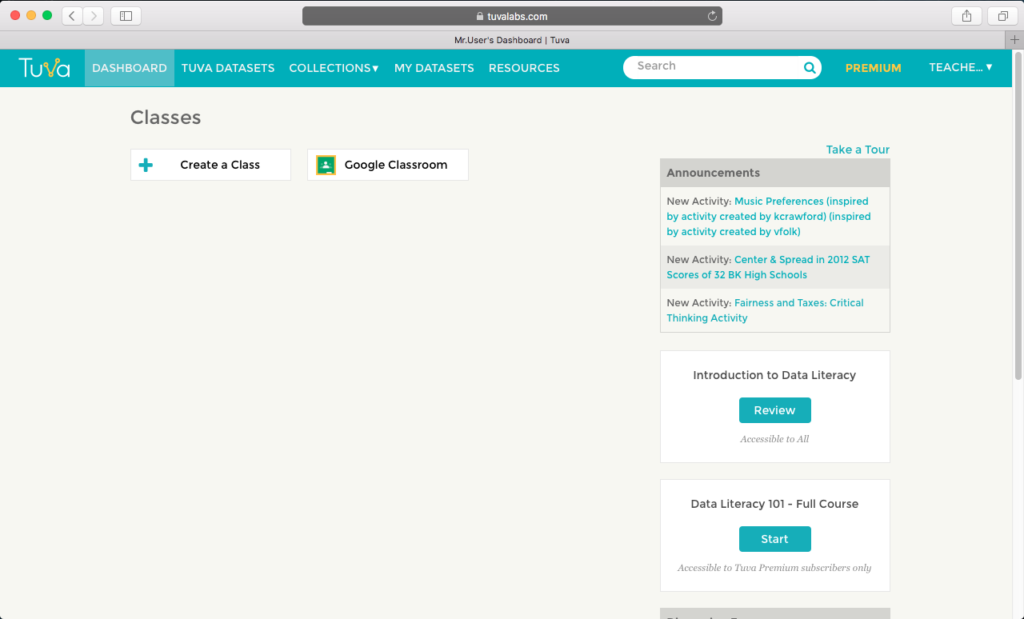
- Select My Datasets on the Dataset Library dropdown.
- Insert or upload data.
- Select the Create Activity button in the lower right corner.
- Create your activity.
- Select Publish.
- Choose one of the options: Publish Privately or Request Public Sharing.
Now, start sharing!
Sign Up for a (FREE) Private Tutorial
We’d be glad to show you how to use the Activity Builder. Sign up for a 30-minute office hours session to meet virtually with one of our educational specialists for a one-on-one tutorial.
