Introducing Data Literacy 101 course on Tuva

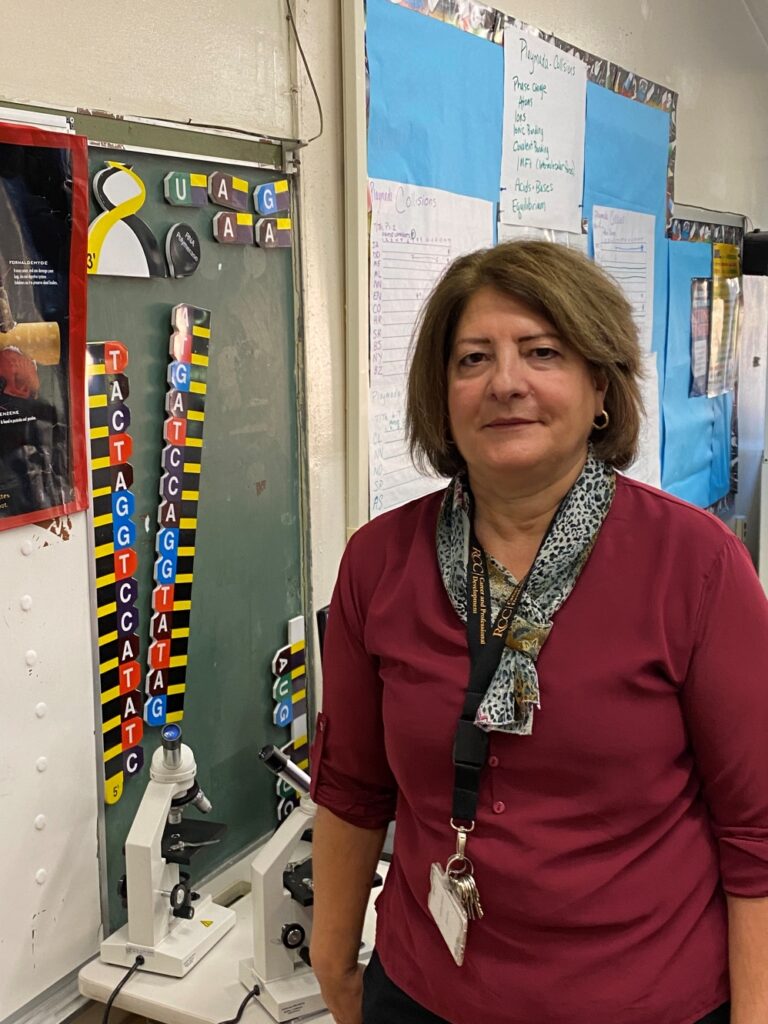
This blog post is written by Molly Schauffler. Dr. Schauffler is an Assistant Research Professor at the University of Maine School of Earth and Climate Sciences. 

Raise your hand if the idea of teaching your students data analysis and statistical thinking is a little unsettling for you.

For many of us who teach social studies, history, language arts, and (yes) even science, it has been a very long time since we took a course in statistics. For many, statistics is a scary label.

Even fewer of us have ever had training in how to incorporate statistical thinking into curriculum for young students. Yet assessments and standards expect our students to analyze and interpret data and make compelling arguments from evidence. Yikes.

The good news is that statistics educators and education researchers, and Tuva, promote an initial exploratory approach to learning how to think statistically about data. Research finds that students have lots to say about data once they have tools, opportunity, and guidance to explore data informally and reason about the stories they find.

Quantitative, or “Confirmatory” statistical analysis comes later, once students grasp challenges of making informal inferences about groups and attributes that are variable. 

In Exploratory Data Analysis, students first learn to recognize and talk about variability, and how variability and certainty are related. They learn to explore data, make informal claims, and develop language for describing their data.

If you feel hesitant about guiding students in data analysis, you are not alone. Many of you have asked for some kind of “orientation” for students starting out with data on Tuva. 

Today, we are excited to launch Data Literacy 101, a course with modules and lessons designed to establish fundamental exploratory data analysis skills (“Level I”).  

image

In the coming weeks, we will add lessons that scaffold students in more quantitative analyses (“Level II”), that then launch them into a grounded and integrated approach to analyzing data as evidence (“Level III”).

Data Literacy 101 lessons incorporate pre- and post-assessment questions to help identify gaps and gains in learning. Lessons are tagged to identify relevant data literacy standards. Follow-on activities will give students practice in skills just learned in a lesson using datasets tagged by content area. 

In addition to building students’ skills, Data Literacy 101 is a useful reference if you want to refresh your own familiarity with basic statistical concepts and tools and language.  

Data Literacy 101 can help you and your students experience the fun of playing with data and telling the stories they find. Let’s get started! 

More Updates to the Filter Bar

We have made additional updates to the Filter Bar on Tuva Datasets, following up from our announcement a few weeks ago regarding a more powerful Filter Bar. 

Now, you can filter for Tuva Datasets and activities by a specific Common Core Math Standard, Domain, or Topic.

The CCSS-related Filter categories include: Comparing Groups, Correlation, Comparing Data, Linear Equations, Modeling, Quantitative Relationships, and many topics and standards.

In addition, we are continuing to extend our coverage of the Next Generation Science Standards, and have curated a number of fantastic new datasets covering additional NGSS Physical Science, Life Science, and Earth & Space Science standards. To learn more, explore all the datasets in our Tuva Datasets Library

Remember, you can always reach out to us if you are unable to find a dataset for your needs. 

Introducing An Easier Way to Filter & Find Datasets on Tuva!

There are 300+ Tuva Datasets in our library covering topics such as the Climate Change, Land & Sea Animals, Presidents of the United States, and many many more.

Today, we are excited to do an initial launch of a more powerful Filter Bar to meet the diverse needs of our educators within the Tuva community.

A More Powerful Filter Bar:

Now, if you wanted to find all the Science or Environment-related Tuva Datasets that are small in size, you can find them very quickly by choosing Science & Environment in the Subject drop-down and 1-40 in the Size drop-down, like this:

As you can see above, you can now filter and find Tuva Datasets based on a number of additional parameters beyond Subject & Grade Level such as:

  1. The Size of the dataset (How many data points are there?)
  2. The NGSS standard (particularly relevant for all our US Science Educators)
  3. The dataset Language (For our non-English speaking educators and learners)

Now, if you wanted to find all the Science or Environment-related Tuva Datasets that are small in size, you can find them very quickly by choosing Science & Environment in the Subject drop-down and 1-40 in the Size drop-down, like this:

Or, if you wanted to find a dataset that is related to the MS-ESS3-5 (Earth & Human Activity) NGSS Standard, you can find it very quickly by choosing MS-ESS3-5 in the NGSS drop-down, like this:


Send Us Your Favorite Datasets & Win

Do you have a favorite dataset that you have used in your previous lessons or units? Does it come from an authentic source? Is it licensed under Creative Commons? Are you able to link to it?

Send us your favorite datasets to hello@tuvalabs.com over the next two weeks and enter a chance to win a Tuva T-shirt, a Tuva Coffee Mug, and other goodies!

What does NGSS look like in the classroom?

By Stephen Farnum – Middle School Science Teacher, Greenwich Public Schools & Tuva K-12 STEM Content Specialist

When I speak with fellow educators about Next Generation Science Standards, they usually tell me they understand “what” NGSS is, but have concerns about “how?”

How can I help my students meet these expectations? How does my instruction need to change? How am I going to find resources to help?

Tuva is on a quest to help science educators implement NGSS in their classrooms through our growing library of authentic datasets, interactive graphing tools, and ready-to-use activities and lessons. 

One aspect of this is to make it easier for teachers to create their own high-quality, NGSS-aligned lessons. 

In support of this, I recently collaborated with them to create Characteristics of an Effective Data-Driven Science Lesson, a checklist for teachers to use while creating or improving data-driven lessons which combine science, math, and problem-solving. 

I combined input from the NGSS Science and Engineering Practices as well as what I’ve learned from my students as they have developed their understanding of science and math through data analysis.

Once we completed the checklist, we realized that many teachers would like to see these characteristics of a data-driven science lesson in action.

Exemplar Science Lesson on Tuva

I created a lesson titled “How to Mitigate Hurricane Damage” to show one way of applying these characteristics to create an NGSS-aligned learning activity on Tuva.

I began with NGSS Middle School DCI: 

“Analyze and interpret data on natural hazards to forecast future catastrophic events and inform the development of technologies to mitigate their effects” (MS-ESS3-2). 

I searched the Tuva Datasets library to find a dataset titled – Hurricane Sandy, Her Brother and Sisters – that was relevant to the DCI. The source of the dataset is NOAA’s National Climate Data Center, and it has 654 Data Points (or cases) and 7 Attributes. 

I used Tuva’s graphing tools to explore relationships between different attributes. Noticing correlations between hurricane latitude, frequency, and severity, I designed a task that would guide students to investigate these relationships: 

“Create an evidence-based proposal for where a new hurricane mitigation structure should be placed” 

You can checkout the finished activity here, and feel free to use it in your classroom during your next Earth Science activity! 

image

Tuva NGSS Resources

The ability to easily find and create open-ended and student-centered learning activities shows Tuva’s potential as a tool for aligning K-12 STEM curricula with NGSS. 

If NGSS leaves you wondering “how?”, Tuva’s NGSS resources are a great place to start.

Introducing the Model Shop – Enabling Students to Learn Modeling

From the CCSS Standards of Mathematical Practice – Modeling with Mathematics practice:

“Mathematically proficient students can apply the mathematics they know to solve problems arising in everyday life, society, and the workplace. In early grades, this might be as simple as writing an addition equation to describe a situation. In middle grades, a student might apply proportional reasoning to plan a school event or analyze a problem in the community. By high school, a student might use geometry to solve a design problem or use a function to describe how one quantity of interest depends on another.” 

From the High School Common Core Standards on Modeling:

“Modeling links classroom mathematics and statistics to everyday life, work, and decision-making. Modeling is the process of choosing and using appropriate mathematics and statistics to analyze empirical situations, to understand them better, and to improve decisions.”

From Science and Engineering Practice in the NGSSDeveloping and Using Models practice: 

“Models include diagrams, physical replicas, mathematical representations, analogies, and computer
simulations. Although models do not correspond exactly to the real world, they bring certain features into
focus while obscuring others. All models contain approximations and assumptions that limit the range of
validity and predictive power, so it is important for students to recognize their limitations.” 

Building on our Signs of Change content initiative that brings history and mathematics together for students, we are excited to announce the Model Shop, our next math and science content initiative dedicated to an incredibly important concept – Modeling.

The Model Shop contains Tuva datasets and activities that enable your students to build a strong foundation about Modeling. Students get an opportunity to use elementary, linear functions to make mathematical models of real data. 

Through our activities and lessons, students will get an opportunity to answer the following questions – What is a mathematical model? How is a mathematical model developed? How does the mathematical model represent our reality, and what is the meaning behind the curve and the parameters? 

We are starting the Model Shop initiative with linear models, giving students an opportunity to create a model for data related to a pencil sharpener, book pages and thickness, Chinese trains, Hooke’s law, and others. Over time, we will continue to add datasets and activities beyond just linear models, including logarithmic, quadratic, exponential, and others. 

All the Tuva Datasets and Activities in the Model Shop are fully accessible only to Tuva Premium customers. Learn more about Tuva Premium here or get in touch with us directly.