
A strand of human DNA is a mere 2.5 nanometers wide. To put that in perspective, a sheet of printer paper is 100,000 nanometers thick. It’s no wonder high school microscopes are not powerful enough to enable students to view DNA! That poses a challenge for high school biology teachers, though. Anything at such an infinitesimal scale is abstract. It’s quite the trick to teach about how structure relates to function for something none of the students have ever seen.
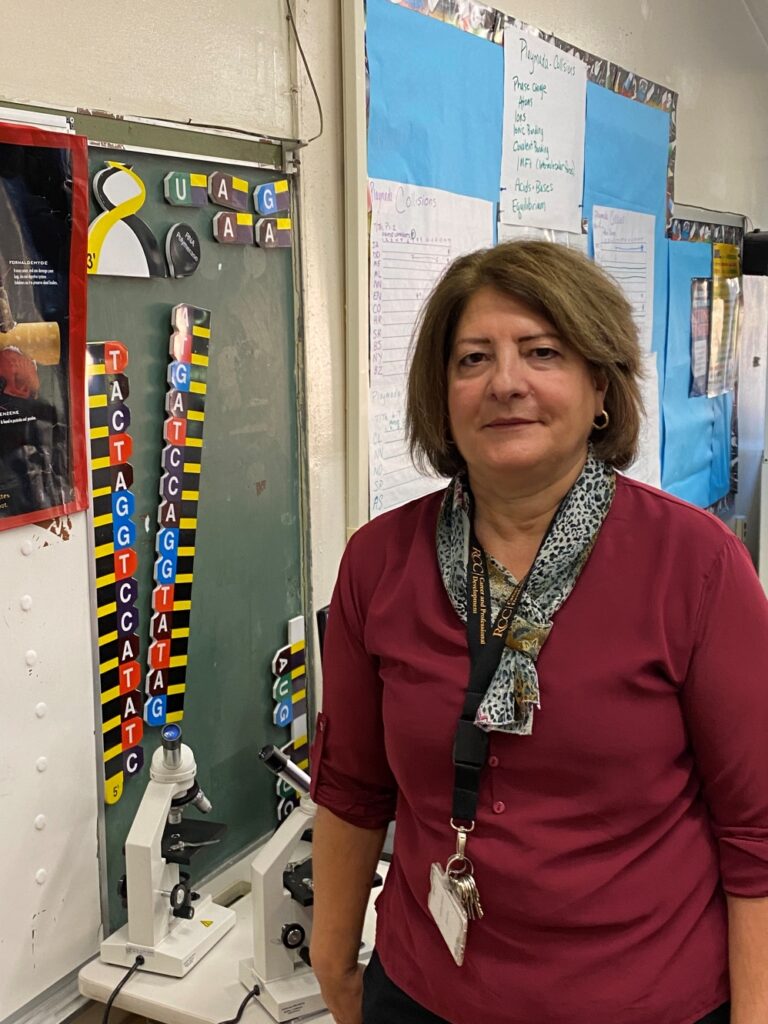
High school science teacher Catia Wolff recognizes the need to make genetics more concrete for her students. This is especially true because of the population of students in her classes.
“Our school attracts students that prefer working on hands-on projects rather than a traditional setting,” explained Wolff.
Wolff teaches at the Rockland BOCES Hudson Valley Pathways in Technology Early College High School, more commonly referred to as Hudson Valley P-TECH. The program is part of the larger New York State P-TECH Program initiated a decade ago with dual goals of preparing students for high-skill, high-wage STEM jobs and ensuring employers have access to a talented and skilled workforce. Students who complete the program at Hudson Valley P-TECH graduate with both a high school diploma and an associates degree at Rockland Community College. The school tends to draw students with a talent for and affinity toward working with their hands.
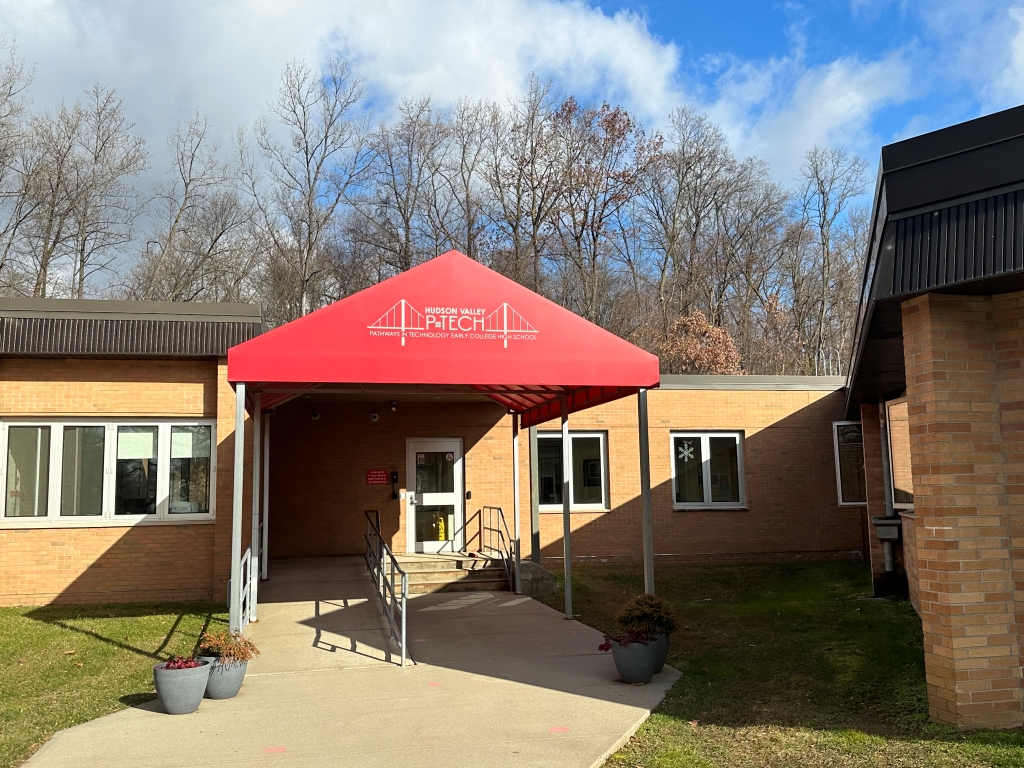
Hudson Valley P-TECH attracts students who are hands-on learners.
Wolff carefully selects and sequences lessons to make genetics more tangible. Her process starts with three-dimensional modeling. She gives her students a DNA sequence. Students create a complementary DNA strand. Then they model the processes of transcription and translation, simulating how a cell carries out protein synthesis.
After completing this process, Wolff found her students were still struggling to understand how all the cells in our body can have such drastically different characteristics while housing identical DNA. They didn’t understand what gene expression means. They needed something more. What Wolff did next did not surprise P-TECH Guidance Counselor Allison Paul.
“Tuva caught my eye right away. Students can see it, they can manipulate it. They can do it. They’ll say, ‘Look what I made!’”
“She is always learning. When most teachers just want to take the summer off, she is taking a course. She is constantly learning and constantly trying to improve,” said Paul.
Instead of adding in a lecture, reading or video, Wolff began searching for resources that would cater to her students’ learning style. What she found was Tuva’s activity Genes: To Express or not to Express? That is the Question.

The activity uses a dataset curated from The Human Protein Atlas, a Swedish-based program with the aim to map all the human proteins in cells, tissues, and organs. Tuva’s dataset includes 35 different genes, the function of the proteins they code for, and whether or not those genes are expressed in the tissues that make up the eye, skeletal muscle, stomach and tongue. During the activity, students look for patterns of gene expression and hypothesize an explanation of the results.
“They had to figure out the puzzle. It made them really think. It really sparked conversation,” said Wolff
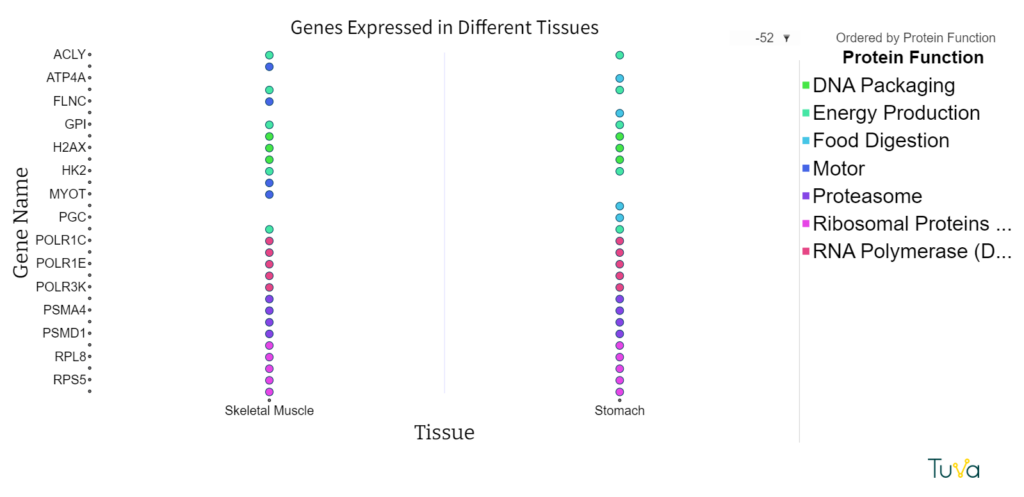
Throughout the course of the activity, students use Tuva’s drag and drop graphing tools to create visuals that help them compare the tissues and puzzle out why some tissues express certain genes while others do not. Wolf observed that having a model, a graph that students could actually see and manipulate, helped them comprehend how DNA connects to cell function.
“Tuva caught my eye right away,” Wolff explained. “Students can see it, they can manipulate it. They can do it. They’ll say, ‘Look what I made!’”
Why do you think the topic discussed in Data Visualizations Make the Invisible Visible for Hands-on Learners is important?