Real-world pedagogy and data literacy are at the heart of Tuva’s mission. Today, we are advancing that work further by enabling you to create custom activities in Tuva using your own data.
The Tuva Activity Builder allows you to place your best lesson ideas beside our powerful, accessible data visualization tools. That means the ability to quickly explore data and create, revise, and analyze graphs will be right at your students’ fingertips.
Five Reasons to Take Advantage of Tuva’s New Activity Builder
1. Strengthen Connection, Deepen Comprehension
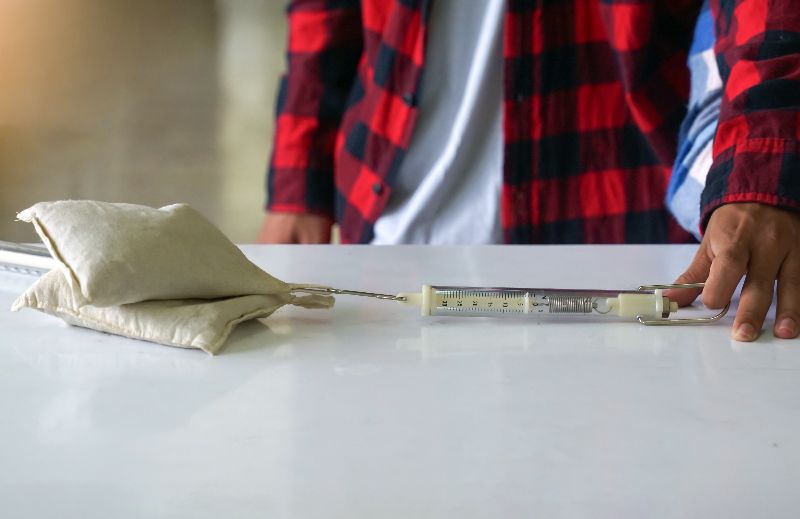
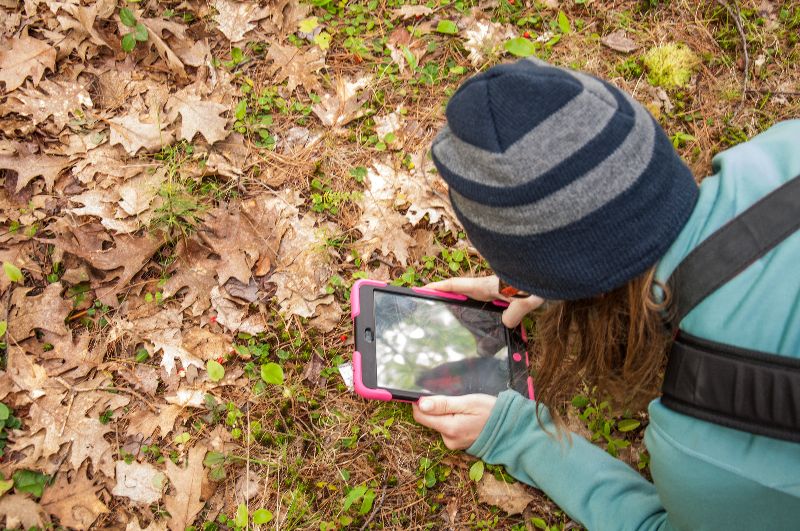
Collect data with your students one day, then incorporate their dataset into a lesson on Tuva for the following day. Students will have a deeper connection to and comprehension of the data when they’ve collected it personally.
This deep involvement in the entire science process–from collection to sophisticated visualization and analysis–helps students see themselves as scientists, not just people learning about science.
2. You Pick the Phenomena, We Provide the Tools
Your creativity far exceeds the bounds of our Science Content Library; we simply cannot encompass every possible anchoring phenomenon. The ability to craft lessons in Tuva from your own datasets allows you to stick closely to your anchor phenomenon without sacrificing the benefits afforded by the Tuva tools.
3.Create Lessons That Speak to Your Students
Relevance drives student engagement. Use local data to center your math or science lessons around places familiar to your students. Alternatively, capitalize on your students’ unique personalities by pulling in data about topics you know interest them.
4.Make Graphing Accessible to All Learners
Our tools are designed to be accessible for learners with diverse abilities. So, when you create your lesson in Tuva you can rest assured all students will be able to engage meaningfully with data. (Learn more about Tuva’s Commitment to Accessibility.)
5.Strut Your Stuff and Help Make the Future #DataLit
You’re brilliant. Your work should be shared. You can now enable school colleagues and far-flung teacher friends to use more data in their instructional practice by sharing a direct link to your original lessons in Tuva. (And while you’re at it, remind them to hit you back. It’s a team effort.)
How to Get Started Building Lessons
Select My Datasets on the Dataset Library dropdown.
Insert or upload data.
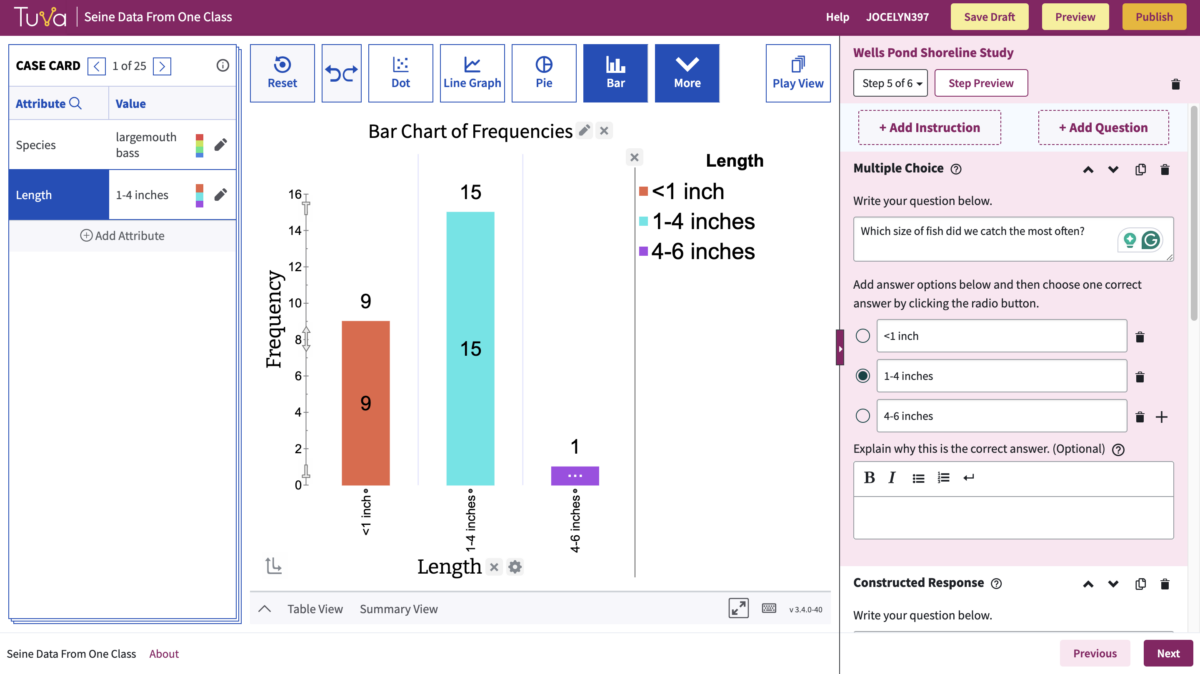
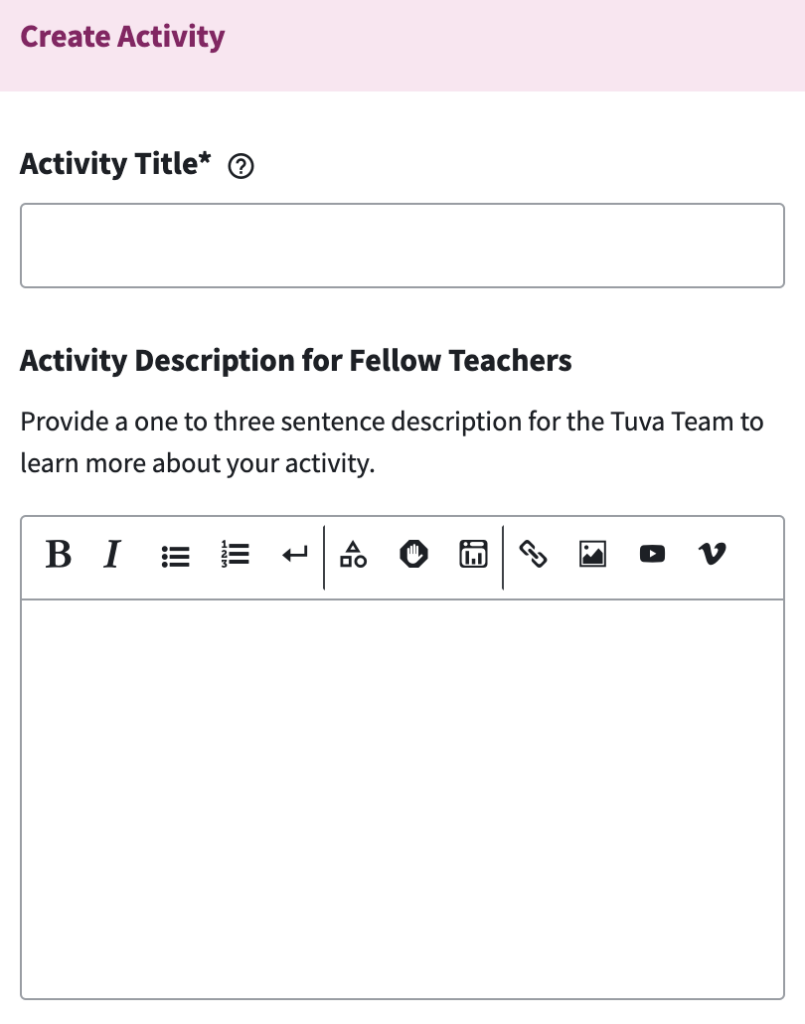
Select the Create Activity button in the lower right corner.
Create your activity.
Select Publish.
Choose one of the options: Publish Privately or Request Public Sharing.
Now, start sharing!
Sign Up for a (FREE) Private Tutorial
We’d be glad to show you how to use the Activity Builder. Sign up for a 30-minute office hours session to meet virtually with one of our educational specialists for a one-on-one tutorial.
A team of ten Massachusetts 12- and 13-year olds want community members in the Narraganset Bay Watershed to change their behavior.
Their advice? Apply phosphorous-free fertilizers, use plantings to filter water, and convert impervious surfaces to absorbent ones. All of these changes, they say, will help prevent harmful algal blooms (HABs) in the bay.
The students reported, “Phosphorous, even in tiny amounts, can trigger HABs,”
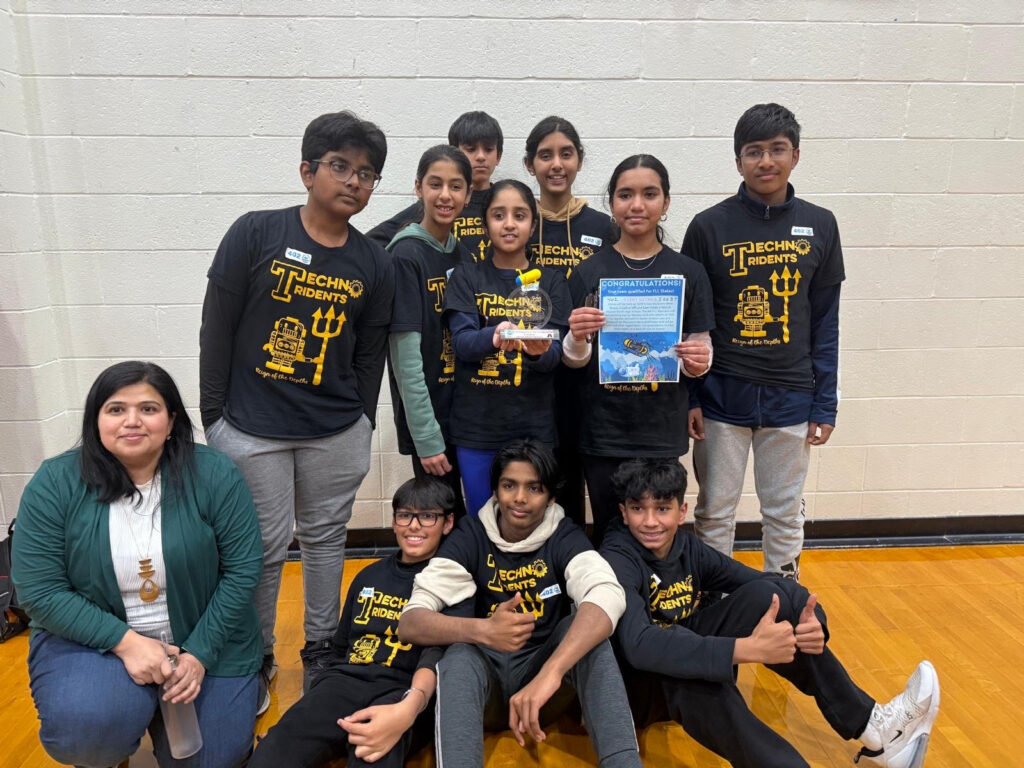
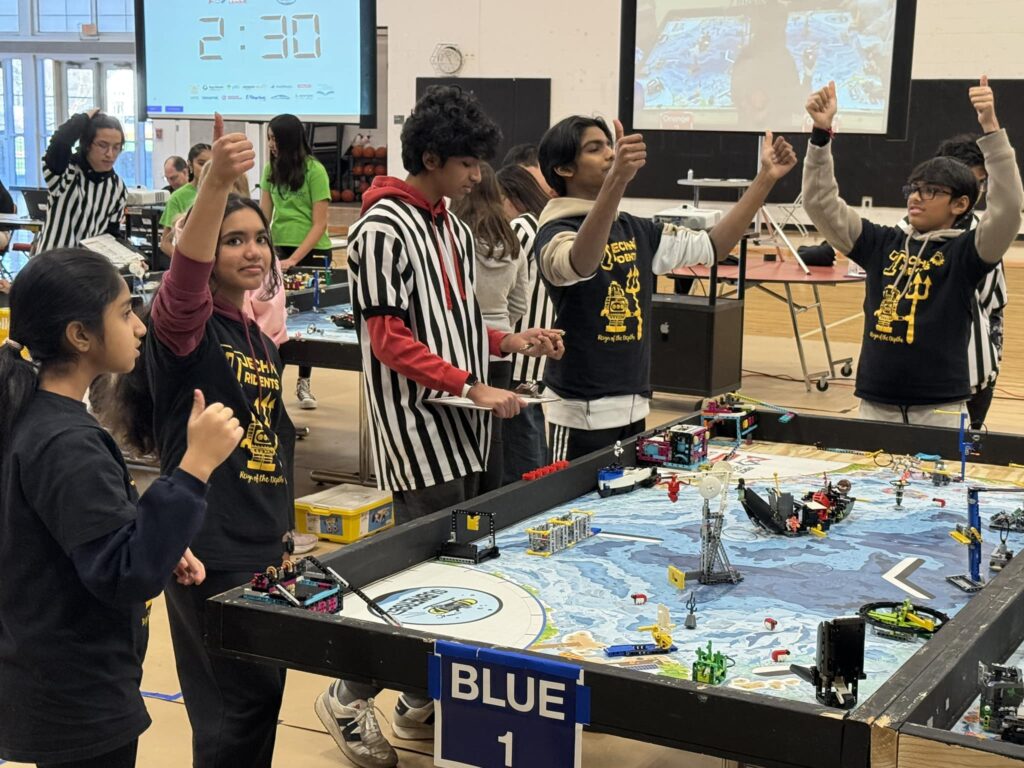
The youngsters, who call themselves The Techno Tridents, are all members of a robotics team from Eastern Massachusetts. They became concerned about the nearby estuary this fall when they began preparing for the 2024-25 FIRST LEGO League Challenge. The annual challenge always includes two major parts: designing a robot and conducting a research project. The research portion requires teams to identify a problem related to the year’s theme, find out as much as possible about the problem, and work out an innovative solution. This year’s challenge theme was “submerged” and centered around oceanography.
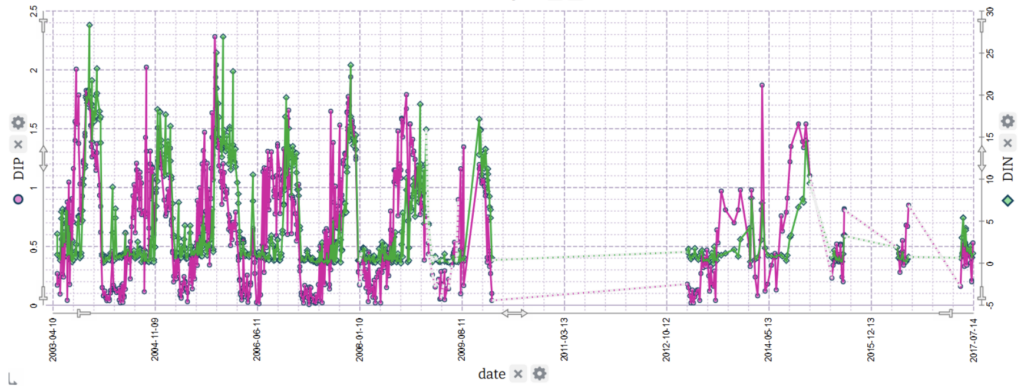
The Techno Tridents quickly became intrigued by HABs, particularly an infamous Narragansett Bay bloom in 2003 that resulted in massive fish kills and shellfish recalls. The team wanted to know what brings about these blooms.
The first dataset The Techno Tridents used. Explore it in Tuva.
The dataset most helpful for their inquiry was about nutrient levels in Narragansett Bay and comprised 1,229 datapoints. It was marked “advanced- HS recommended.” The columns across the top of the spreadsheet simply listed date, depth, NH4, DIP, NO3 + NO2, NO3, NO2, and DIN. The problem? Many of the Techno Tridents had not yet completed a middle school chemistry unit let alone a high school chemistry class.
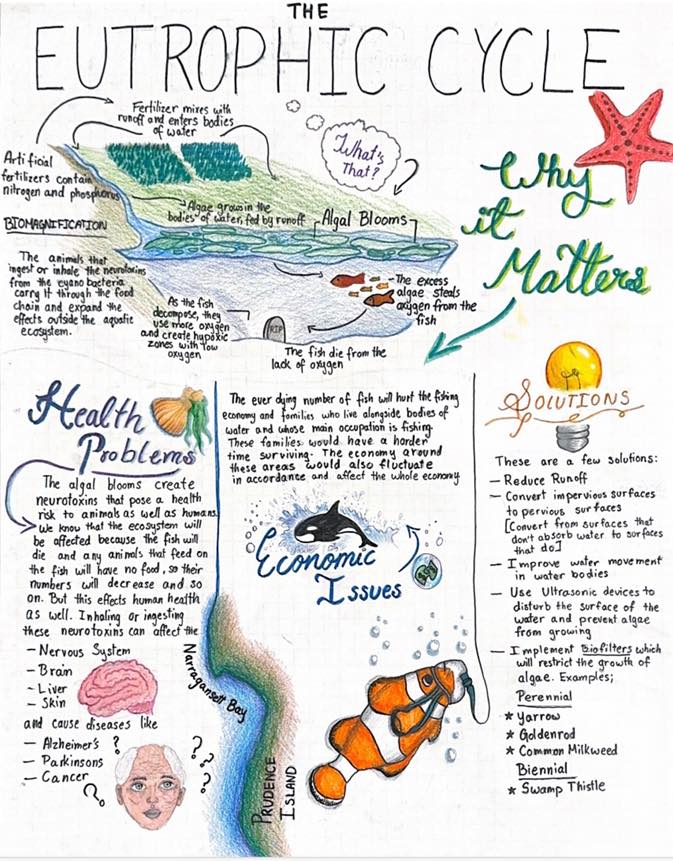
Poster created by 8th-grader Akshita Serikar,
To fully understand the data, the team needed to learn more about science concepts above their grade level such as the nitrogen cycle, the Periodic table, valency, ionization, pH, and eutrophication.
“There was a huge learning curve,” said Naravane. She laughed, admitting that, as an engineering teacher, she was included in that learning curve. “I just let them lead it,” she said.
Untangling the Data With Tuva
The students now faced the challenge of making sense of a complex, multivariate dataset. This is where Tuva became indispensable. The students uploaded the data provided by NES LTER into Tuva for analysis.
Naravane described Tuva as a “centerpiece” in helping her students uncover associations between variables. Using Tuva, students explored data analysis techniques. They learned how to add two variables on one axis, create dual-axis charts, and identify correlations. Tuva’s intuitive tools gave them insights that other software couldn’t match.
“Tuva labs is very sophisticated in the way that it allows you to see data,” Naravane said.
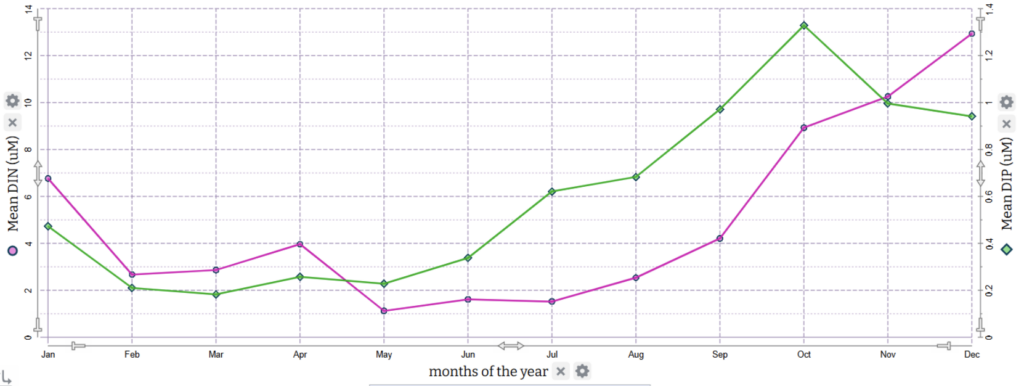
The story the data revealed was compelling: nutrient levels in Narragansett Bay spiked in October and November. Intrigued, the students sought to uncover the reasons behind this pattern.
The Techno Tridents included this graph in their project summary, writing, “The nitrogen and phosphorus spike in the fall… It is repetitive and we can see that the spikes are always more than 16uM of Nitrogen and 1.5uM of Phosphorus in October-November.“
To build a more complete picture, they explored additional attributes like temperature, rainfall, salinity, and occurrence of phytoplankton species. They discovered that October is when the water reaches its warmest temperatures and more rainfall occurs, contributing to increased runoff. This surge of nutrients, combined with peak temperatures, create ideal conditions for algal blooms.
Try using Tuva to look for relationships between sea surface temperature and phytoplankton.
Their analysis didn’t stop there. Using maps, the students noticed a high density of golf courses and lawns in the Narragansett Bay Watershed. Further research revealed that fall is a common time for lawn fertilization, adding another piece to the puzzle.
“We found a lot of these rabbit holes of science we could walk off into. And that’s exactly the kind of science learning I want,” Naravane said. “ You never get a chance to learn other things, unless you are powered by curiosity.”
Techno Tridents Secure Second Place With Data Analysis and Awareness Campaign
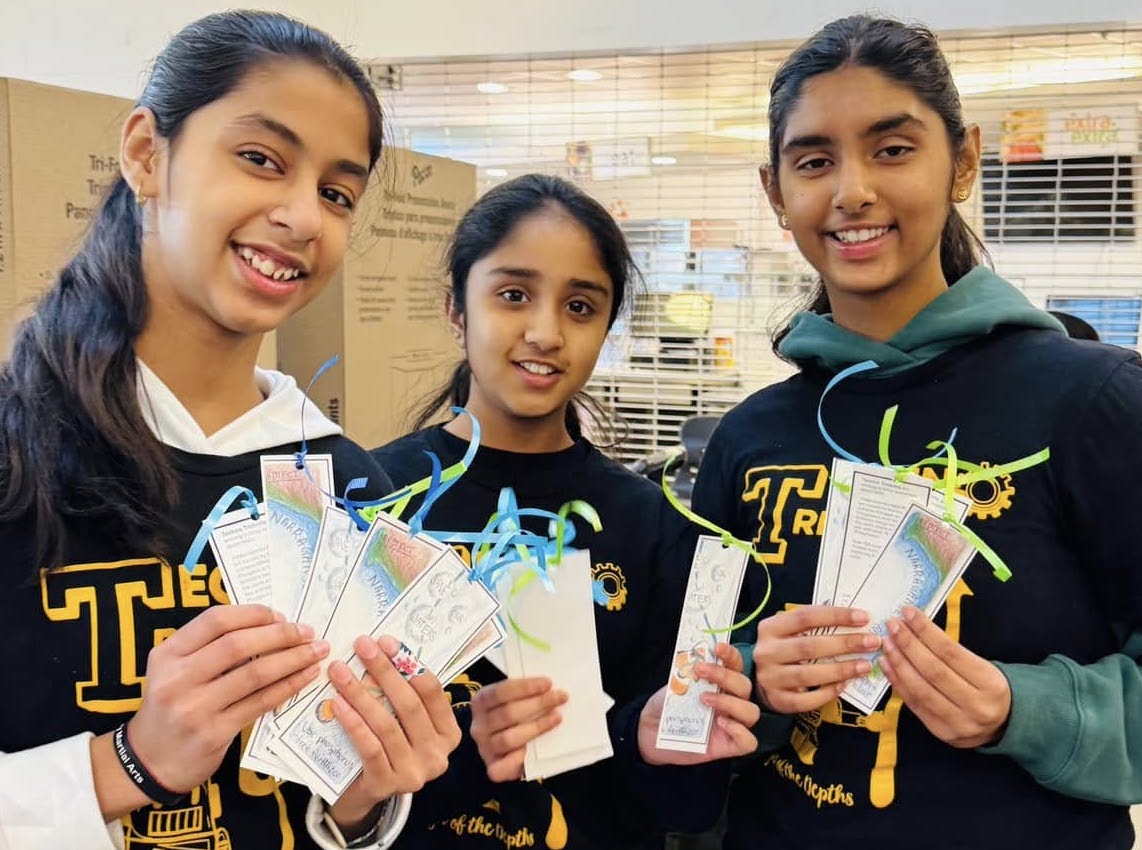
Based on all of the data, the students decided to launch a campaign to educate their community about responsible fertilization techniques. Their campaign included a variety of modes of communication: bookmarks with illustrations on one side and information on the reverse; an intricate, hand-drawn poster; and a Scratch animation.
Their data-backed campaign, along with their robot, helped the Techno Tridents land a second place finish in the Northborough FIRST LEGO League qualifier. Their work has also attracted the attention of other local organizations- including environmental non-profits looking to collaborate and a science-based art gallery that is going to display Serikar’s art (above).
Data’s Important Role in Innovation
Naravane coaches six teams via her small business Planet Robotics. Her work with students mainly centers around engineering. She is convinced that data needs to play a larger role in the engineering process.
“I really believe data is a new way to see things,” Naravane said. “If you don’t know what you are studying, how do you know it is a problem?”
Multilingual learners are the fastest-growing population of K-12 students in the U.S. Throughout the past six months, Tuva has taken a number of steps to ensure multilingual learners have access to rigorous STEM instruction.
1. Added a Keywords Feature
Academic language differs markedly from the language used in everyday social interactions. Fluency in conversational English doesn’t equate to academic fluency. That’s because social vocabulary is usually acquired within two years, whereas academic vocabulary can take up to 10.
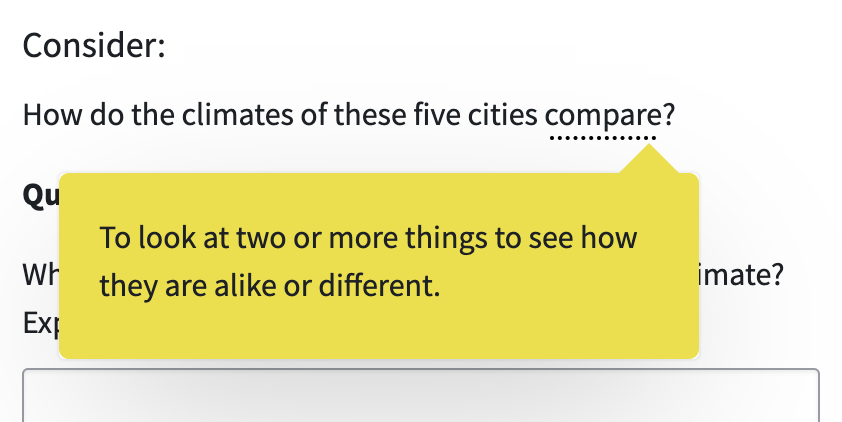
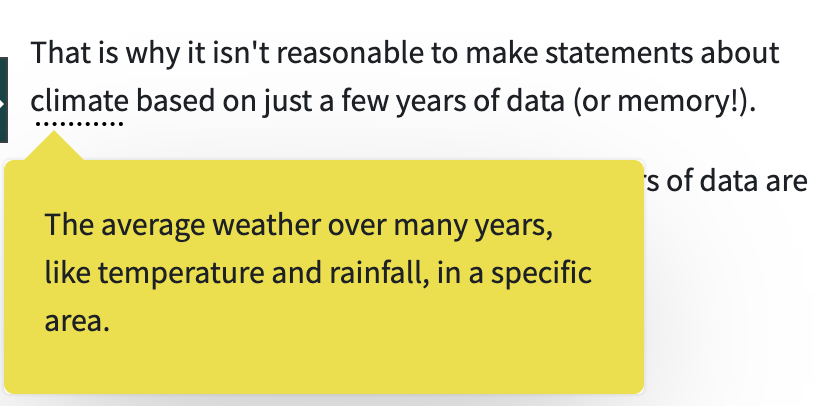
To support students as they develop academic vocabulary, Tuva has added a keywords feature. When students click on an underlined keyword, a definition will appear. These definitions are written at a 6th-grade reading level.
Many of Tuva’s keywords are tier two vocabulary words.
Tuva’s keyword feature defines terms not frequently heard in everyday conversation. This includes tier two vocabulary, academic language used across multiple subject areas (e.g. clarify, analyze,compare), and tier three vocabular, disciplinary-specific terminology (e.g. photosynthesis, velocity).
Other keywords are tier three vocabulary.
2. Authored WIDA-Aligned Lessons
Using the WIDA framework, we’ve begun weaving multiple English language development supports into our math and science lessons.
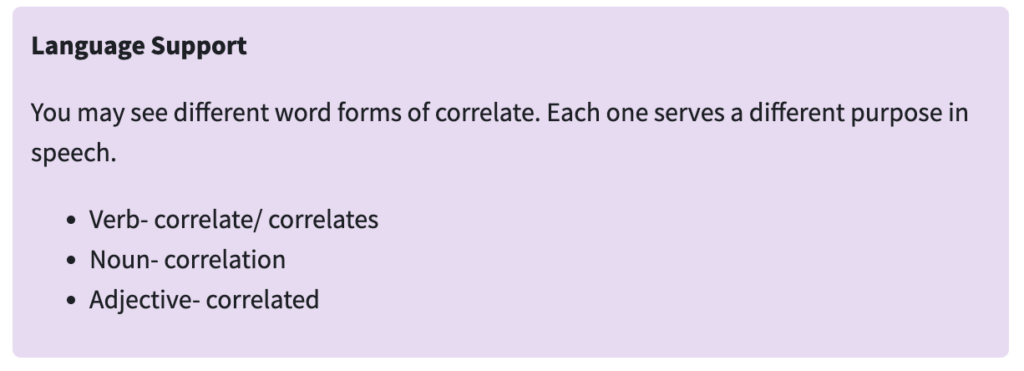
Language Support Tips
All learners, but especially multilingual learners, benefit from explicit instruction in academic language usage. Our newest lessons include language support tips such as sentence starters, instruction on parts of speech, or lists of helpful phrases for using data to inform, explain, or argue.
Prompt Discourse Conversation with peers helps multilingual students build a more nuanced understanding of STEM concepts. It also gives learners more opportunities to practice academic vocabulary and language.
We’ve made a concerted effort to promote discourse in any new full-length lessons and activities. By adding “Discussion” prompts to the lessons, we encourage students to discuss their thinking aloud.
Try One of Tuva’s New WIDA-Aligned Lessons
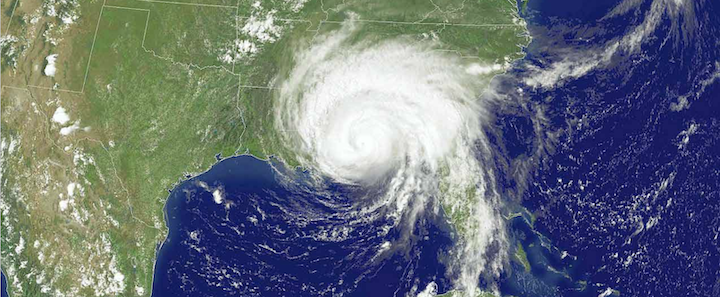
Elementary STEM: Preparing for a Hurricane
Secondary Math: Tackling Correlations
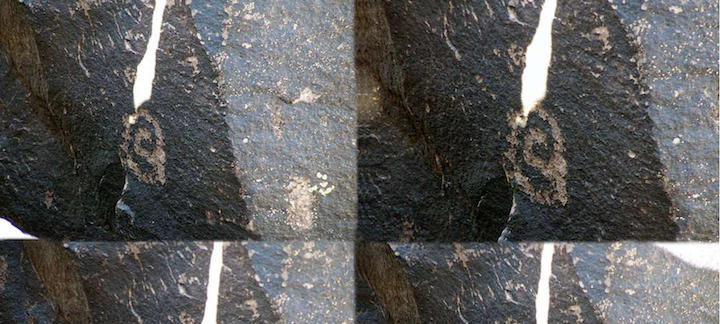
Secondary Science: Sun Seekers of Turtle Island
Check out our other lessons intentionally designed to support multilingual learners. View our secondary STEM lessons with ELD support or our elementary STEM lessons with ELD support.
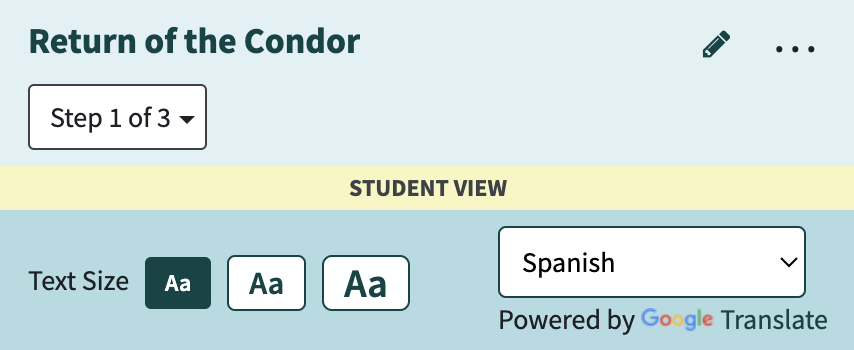
3. Enabled Easy Language Translation
Translanguaging boosts STEM comprehension. It also accelerates English language development. Thus, Tuva has prioritized making it easy for users to switch between languages in our lessons. Simply click the three dots in the upper right of the instruction panel to make the Google Translate widget appear.
Knowing how to create graphs by hand is an essential skill.
That may have been unexpected, coming as it does from the blog of a digital graphing tool. However, it’s important to clarify that using a graphing tool, like Tuva, and manually graphing are not at odds with each other; nor does one necessarily serve as a prerequisite. In fact, as the middle school science team at Northwest Middle School discovered, the two approaches are synergistic.
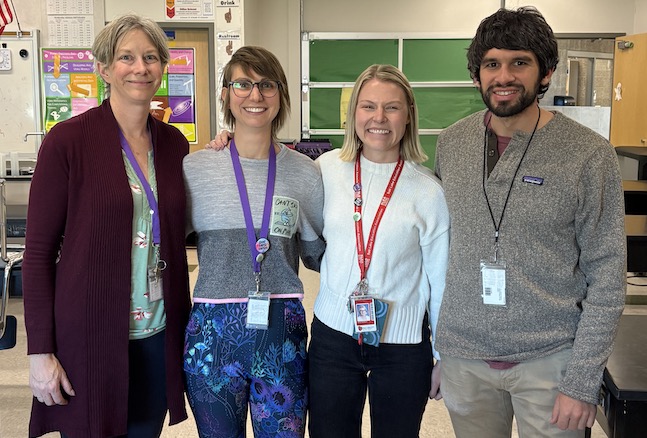
Northwest MS teachers Judith Neugebauer, Victoria Mauro, Anne Salisbury, and John Pikus.
“[Our students’] ability to see the numerical data in a graphical form is really transitioning from one realm to the other,” explained teacher Judith Neugebauer.
The team, which also includes teachers Victoria Mauro, Anne Salisbury, and John Pikus, is based out of a school in Salt Lake City. They began augmenting their manual graphing practices with Tuva’s digital graphing tools about a year ago.
The Most Persistent Problems for Novice Graph Creators
Adding digital graphing tools to the mix for novice graph makers is a step some are reticent to take. (Psst… I used to be amongst them.) Because digital graphing tools automatically do some of the steps for students, teachers wonder if students should know how to graph manually before they begin utilizing digital tools.
Before we address that concern, let’s take a step back to consider the most common skills with which novice graph makers struggle:
Placing variables on the correct axes
Setting up equal intervals and scaling them appropriately
Choosing an appropriate graph type
Accurately plotting data points
Including descriptive titles
The question is, then, will using digital graphing tools before students have mastered manual graphing prevent students from developing these important skills?
Better Together
Data literacy education expert, Molly Schauffler said that 15 years ago she would have said yes, but the development of drag-and-drop graphing tools, like Tuva, shifted her perspective.
“My sense now is that playing with the data and visualizing it on a digital platform gives students a visual sense of purpose, direction, possibility, and choice without getting mired in drawing and mechanics,”Schauffler said. “That said, I am still an advocate of hand drawing graphs alongside digital exploration.”
Schauffler is a founding member of a group called Partners in Data Literacy, a paleoecologist, an assistant research professor emerita for the University of Maine, and a former Tuva consultant.
“We still have them graph in their notebooks too, but this year it’s going way faster.”
The benefits of using both methods simultaneously are evident at Northwest, where teachers say making graphs on Tuva has hastened the development of manual graphing skills for their 7th- and 8th-grade students.
“We still have them graph in their notebooks too,” Neugebauer explained, “but this year it’s going way faster.”
The teachers there credit the uptick in pace to repeated exposure to and practice with variable placement and graph types in Tuva.
Our Suggestions for Achieving Synergy
Digital graphing tools exist on a spectrum from fully automated to completely open and incremental. When combining manual and digital graphing practices, consider how the features of the digital tool may impact skill development.
For Tuva users helping graphing novices master the five skills listed above, we suggest pairing manual graphing and Tuva in the following way:
Practice Manually
Practice With Tuva
Setting up equal intervals and scaling them appropriately
Placing variables on the correct axes
Accurately plotting points
Choosing an appropriate graph type
Adding descriptive titles
In most instances, Tuva sets up intervals and plots data automatically once students have chosen which attributes (variables) to drag to which axes. Doing these things manually helps students understand a block on the graph represents a specific numerical increase.
That said, it is not necessary for students to practice establishing equal intervals and plotting data points every time they graph. In fact, sometimes it gets in the way of the other skills students are trying to master. Making graphs manually is so time-consuming that it is hard to achieve rapid repetition of a skill. Repetition is incredibly helpful for achieving mastery when it comes to placing variables, choosing graph types, and writing titles. Tuva enables targeted practice in these aspects of graphing. Students can also quickly and easily fix errors instead of needing to start all over, avoiding frustration and shutdown.
Swapped axes are a common woe of novice graphers. Repeated practice can help.
Are We Graphing for Graphing’s Sake?
Perhaps, however, this entire discussion misses the point. Why is it important for our students to be able to create graphs? Is it simply so that they can create graphs? Of course not. The ultimate goal is to empower students to uncover insights about data through their graphs. Scientific literacy and data literacy are, after all, inextricable.
It’s easy to lose sight of that goal, however, in the day-to-day slog of asking kids over and over and over, “If you count up by ones, will you have enough space on your graph paper?” or, “Where does the independent variable go again?” And if we’ve lost sight of our goal, chances are our students never even knew a larger purpose existed in the first place. Of course, student motivation suffers when there is a lack of purpose.
Northwest teacher Anne Salisbury said Tuva has helped boost student engagement in the graphing process.
“I think using Tuva has convinced them that graphing has a purpose,” she said. “The point is not just to make a graph; it’s to use a graph. In the past we spent so much time getting them to physically graph on paper, that we did not have time to analyze data that is already graphed and figure out what it means.”
Before Maria Lee became a science teacher, she was an environmental scientist. Her experiences working on salmon restoration in Washington State influence her approach to instruction.
“Primarily, I understand the importance of data,” Lee explained. “Data is not perfunctory; it is really an essential part of understanding science.”
As such, Lee dedicates a substantial portion of her high school biology course at East High School in Salt Lake City to the mathematical aspects of scientific understanding. In the past when working with data, Lee has had students use premade graphs or make their own using spreadsheets. This year, she opted to use Tuva. Now Lee calls out Tuva as one of her three favorite curriculum supplements, alongside leading EdTech platforms Newsela and Nearpod.
Lee was introduced to Tuva last year, but was hesitant to use it, fearing the learning curve would be steep. When she finally dove in this year, she discovered her worries were unfounded. Lee noted she did not spend time learning the Tuva tools in advance, but learned them in tandem with her students.
“ After just one day of playing around with Tuva with my students, I felt so comfortable- nearly expert level.”
“Suddenly, They Could See It”
The reasons for Lee’s enthusiasm are multiple. First and foremost, incorporating Tuva has accelerated her students’ learning.
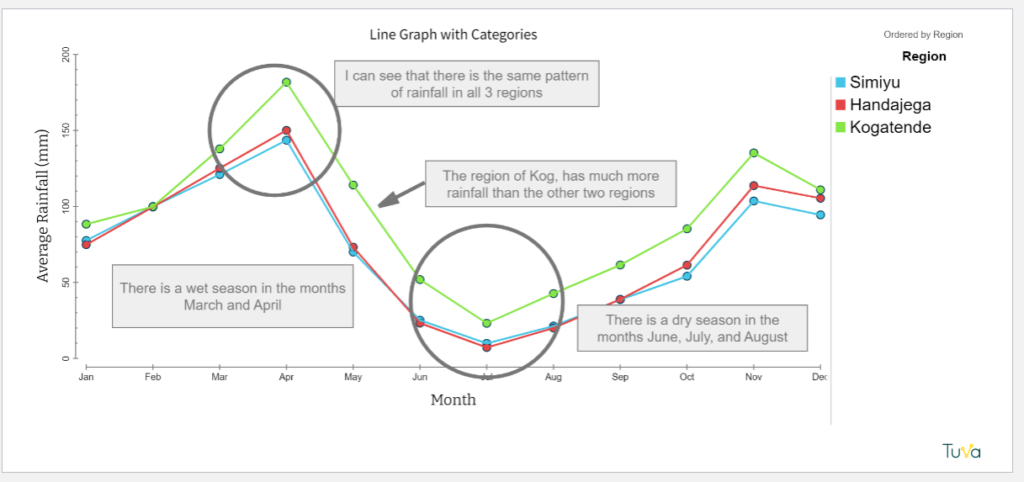
Her first unit, a riff off of OpenSciEd’s Ecosystem Interactions and Dynamics, leaned into analyzing and interpreting line graphs and scatter plots. Lee described a class in which students were identifying whether or not there was a relationship between rainfall and wildebeest behavior in the Serengeti.
An example of student work from Lee’s class.Lee pulled data from OpenSciEd into Tuva.
Up to this point in their OpenSciEd unit, they’d primarily used line graphs to observe change over time. Now, they were struggling with the transition to scatter plots, getting confused about time versus relationship.
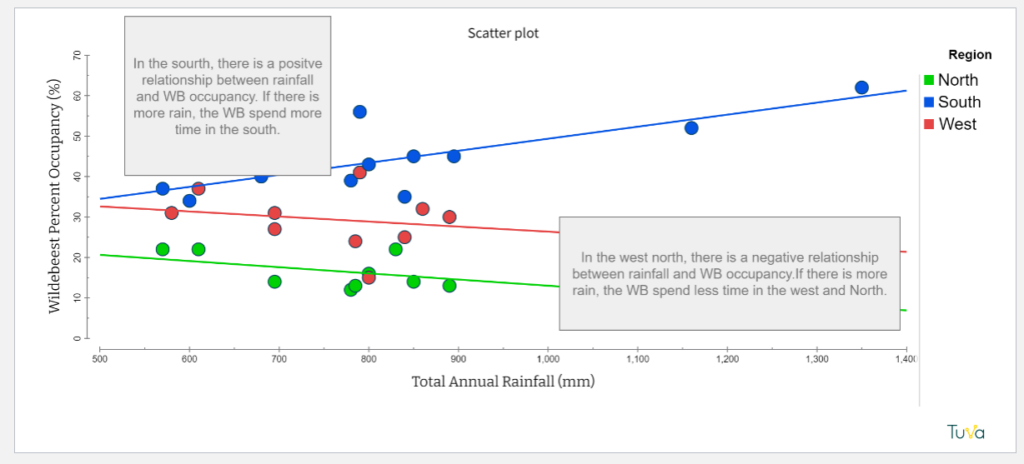
Lee uploaded the data onto Tuva and projected a scatter plot of rainfall vs. wildebeest occupancy on her interactive whiteboard. Then she had students come up and trace the dots from left to right and try to describe what their hand was doing- going up, going down, staying steady, or moving erratically. Some students were getting it, but many were not. Lee had them activate the least squares line.
Then, she said, “suddenly they could see it!” The line helped them ignore the background noise and identify the trend.
Another student work sample, this time with a scatter plot.
Student Ownership
Lee also said she appreciates the level of ownership Tuva gives students in the process of data exploration.
“Tuva puts students first in their interaction with data, so that they are driving their interaction and learning with the data and not getting it secondhand through a teacher filtering it for them.”
This level of independence is possible, she said, because Tuva leaves room for making mistakes and fixing them. With other tools, she’s needed to be more prescriptive because mistakes are harder to recover from.
Academic Communication: Scaffolding Up
Finally, Lee credits Tuva with creating more opportunities for extended learning. For example, when working with a class of multilingual learners, she found that Tuva’s interactive graphing tools accelerated the learning process enough that some students had time to deepen their interpretation.
Her class was working on the Tuva activity Dynamic Wildlife. (You can interact with the Wolf and Elk in Yellowston dataset the activity uses below!) She asked all students in the section to use the Identify and Interpret ( I2) method to discuss the wolf and elk population data. For example, a student might identify, “I see the line goes up at the start of the graph,” and interpret, “This means the number of wolves was increasing.”
Try dragging and dropping Elk Count (observed) onto the Y2 axis.
Many students completed this task quicker than they would have with print resources or spreadsheets. Lee capitalized on the newly-freed time to teach them to add quantitative measures, such as year and population count, to their evidence.
Lee noted that her class’s work with Tuva fits perfectly into the larger district goals, such as strengthening academic discourse and writing. Referring to Tuva as a “writing-science interface”, she said, “It’s the only tool I know that is really actively improving reading and writing skills for science. ”