Data Crosses Disciplines, Yields Powerful Learning
Up until the mid-1800s, children had a 50% chance of dying before age 15. By 1950 the childhood mortality rate was closer to 25%. Today, it sits at 4.3% globally. Childhood mortality rates have experienced a steep, steady decline across the world.

So, when Kate Harrison, a high school junior in Charlotte, North Carolina, was sifting through data about infant mortality rates in different countries, Syria’s data gave her pause.
“Syria in particular has these two spikes, and I got really interested, thinking, what was happening at the time?” she said.
Thus was born a semester-long investigation.
Data Transcends Disciplinary Boundaries, Deepens Learning
Harrison was enrolled in an honors statistics class at Fusion Academy where she’d been charged with undertaking an interdisciplinary project. She’d decided to apply statistics to explore history, but identifying a focus took time.
Her original idea was a bit nebulous, but it centered around trends in warfare over time. To clarify her question, she began exploring data. In the process, she stumbled upon the Syrian infant mortality data. That’s when nuanced and intriguing questions pushed their way to the forefront.
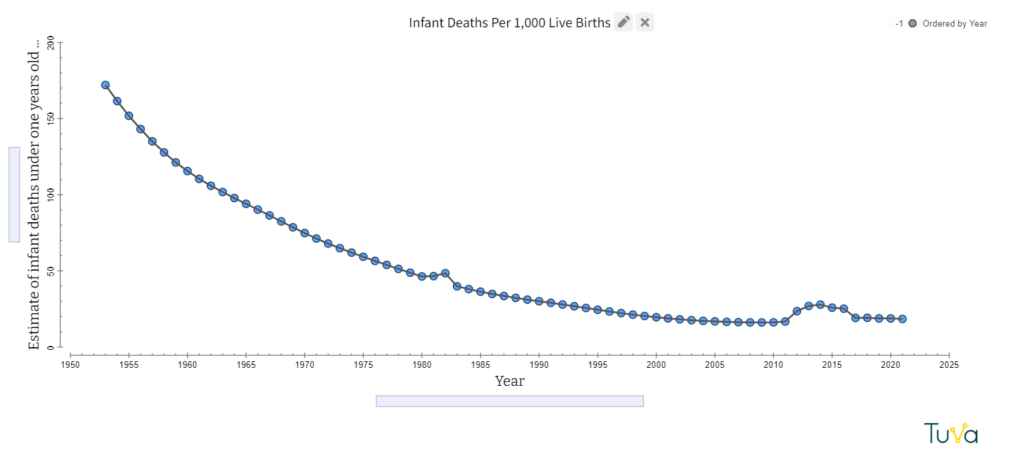
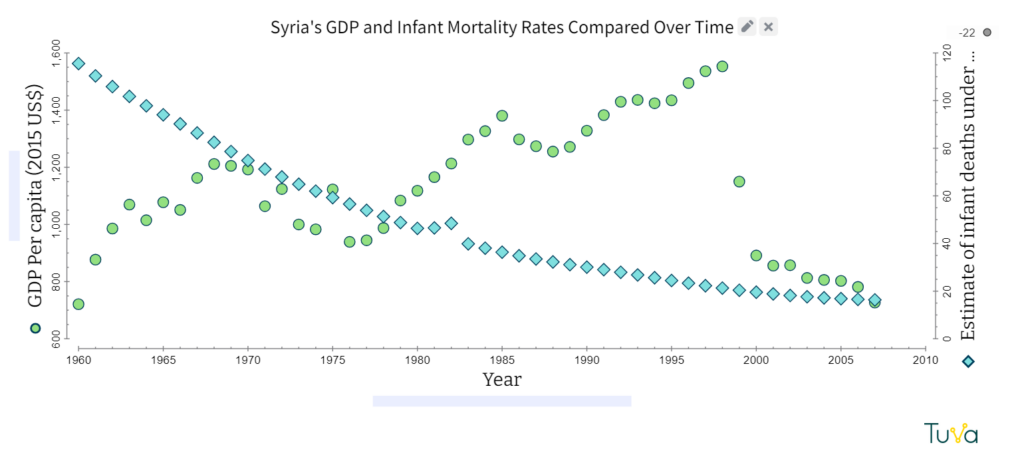
Harrison immediately noted an association between the timing of armed conflicts in Syria and the spikes in infant deaths. She noticed that after the start of the Islamist uprising in Syria in 1981, infant mortality increased by 4.24%. The nation suffered an even more drastic 52.7% increase in the infant mortality rate from 2010-2014 at the beginning of the Syrian Civil War.
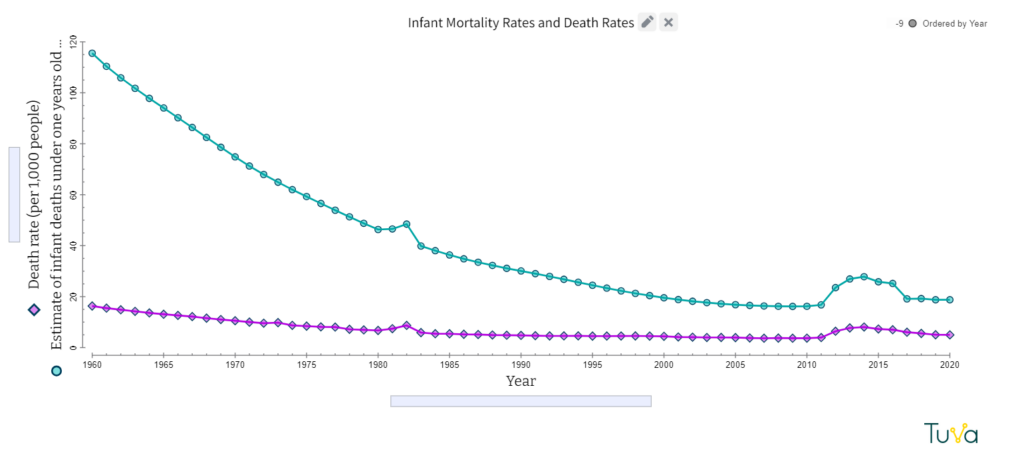
Harrison discovered that in both instances there had been a concurrent rise in overall mortality. However, she knew that infants didn’t fight in the wars, so what were the underlying connections? Harris worked with her faculty advisors, social studies teacher Rick Fera and statistics teacher Chad Boger, to brainstorm variables that may have influenced infant mortality.
Variables she explored included birth rates, governmental regimes, international aid, gross domestic product, basic sanitation, basic healthcare access, and vaccination rates. She compiled data about these factors from Our World in Data and the World Health Organization and imported it into Tuva for analysis. Harrison said identifying changes and interpreting patterns was easier for her when she used Tuva.
“You really just can’t tell using a table because there’s so many numbers and so many different data points,” she said. “And so getting to put that all into one tool and really visualize it without having to go through the hassle of actually plotting out each point, and probably doing something wrong, was very helpful.”
Surprises in the Data
In some cases, Harrison was surprised at the lack of correlation between variables. She had assumed, for example, that GDP would have a large impact on infant mortality rates, but the data did not show a correlation. In fact, Syria experienced a financial crisis a few years before the civil war, but the infant death rate did not experience a resultant increase.
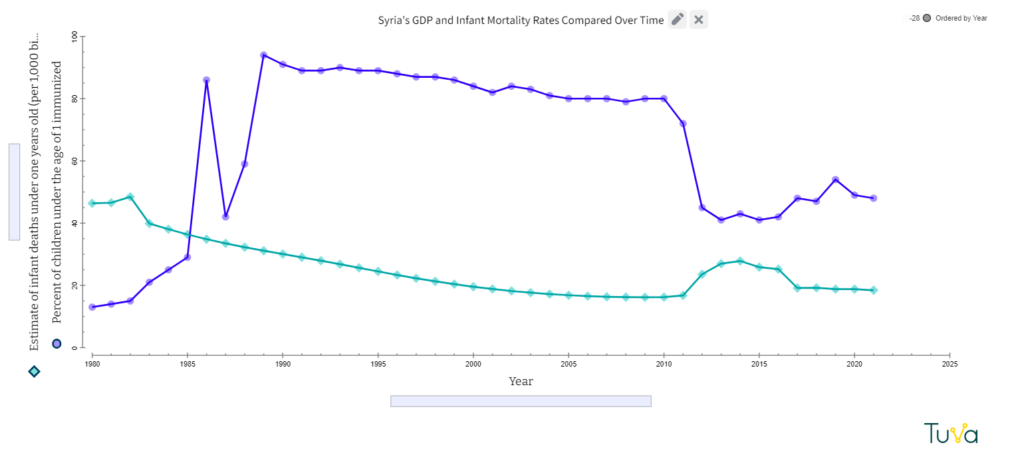
What did show a correlation with infant mortality – vaccination rates. In the early 1980s, Syria engaged in a national immunization campaign, and infant mortality rates showed a steep decline. However, when immunization rates faltered during the civil war and uprising, infant mortality spiked again.
Using Data to Inform Priorities in War-Torn Nations
“This data suggests that immunization programs and keeping healthcare systems intact should be a high priority in war-torn nations,” Harrison concluded. “Several relief programs are focusing on integrated management of childhood illnesses, which includes improving case management strategies of healthcare providers, healthcare systems, and families.”
Boger, Harrison’s teacher, applauded her work, saying she’d exceeded his high expectations. This spring, Harrison will have another chance to explore her passions with a civics math class she’s enrolled in.
“I personally see data as the backbone of any social change.”
She is also beginning to think about life after high school. She’s begun exploring four-year colleges and aspires to pursue degrees in political and environmental sciences.
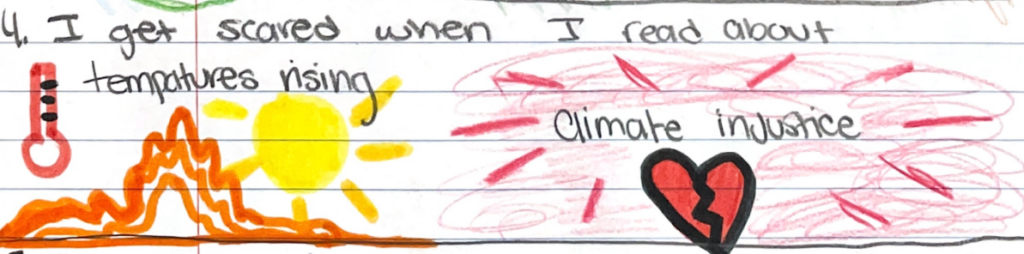
“I personally see data as the backbone of any social change,” said Harrison. “Being able to visualize and look at data clearly is essential to taking meaningful action and maximizing your impact. I see this, especially with environmental justice and climate change. Data will help determine which areas are most in need of relief and which areas will face the most impact. I hope to be able to focus on data-driven environmental policy work in the future.”
Inspired? Explore Data You’re Passionate About
- Find data that sparks your curiosity.
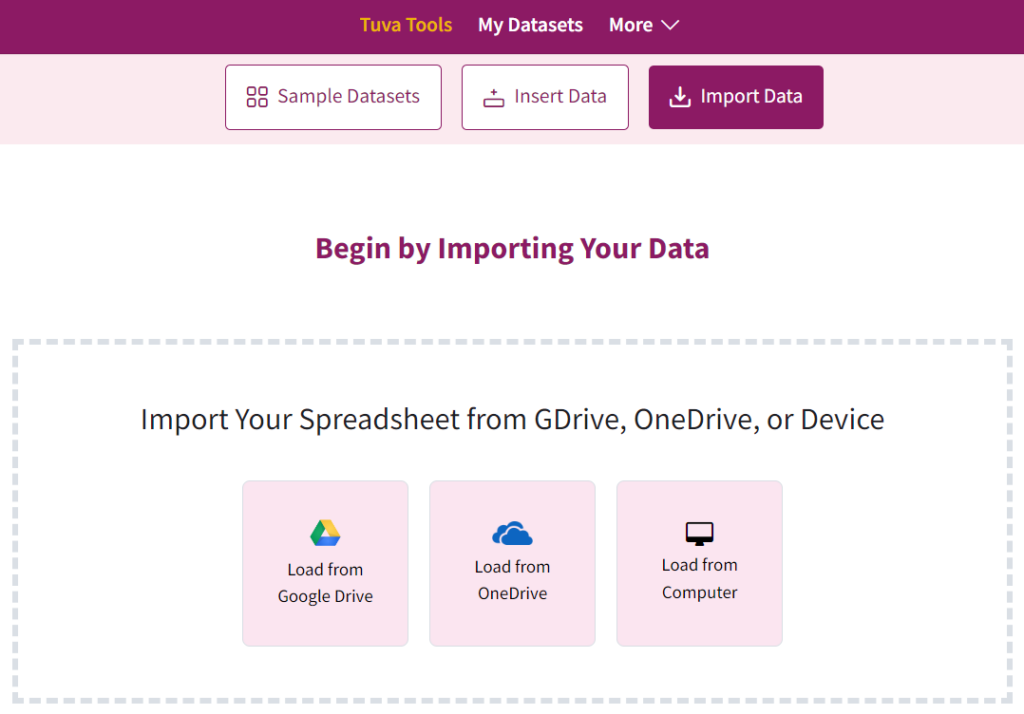
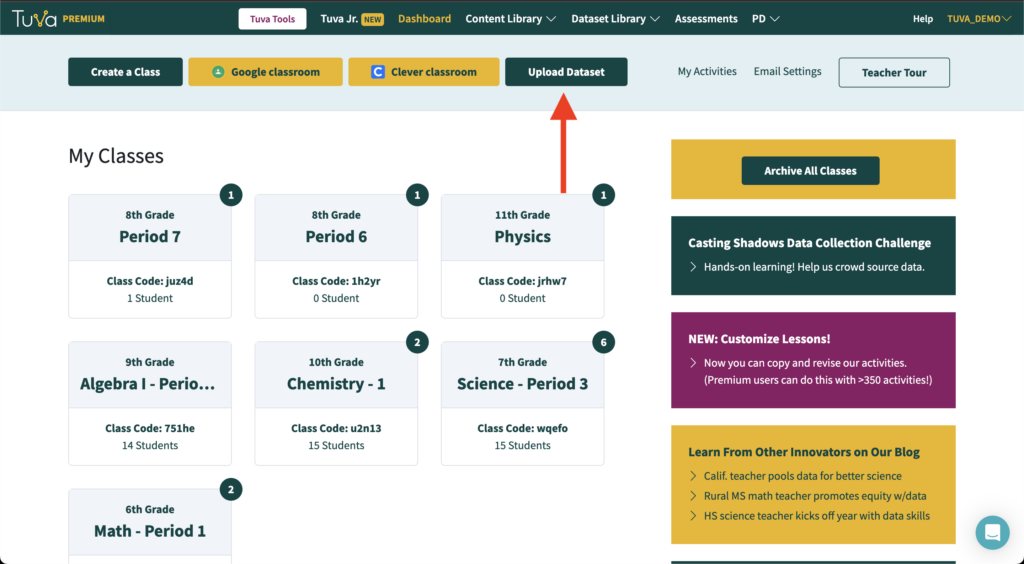
- Click “Upload Dataset” from your Tuva dashboard or type tuvalabs.com/upload in your web browser’s URL bar.
3. You may now import a dataset from your computer, Google Drive, or One Drive, or by dragging and dropping your CSV, XLS, or XLSX file into the gray rectangle.
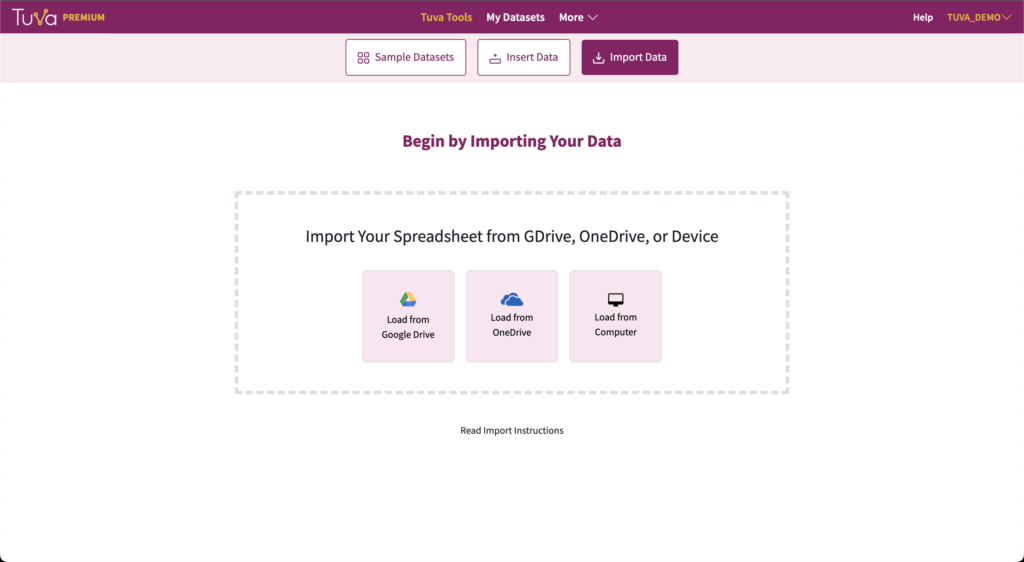
4. You’ll be prompted to review your data. Afterward, you’ll be taken to a visualization screen where you can begin analyzing your data.
For more detailed information and instructions, visit our Support Page: Uploading Data into Tuva. Also, we’d love to see the data visualizations you create! Share it with us at jocelyn@tuvalabs.com.