…and deeper learning ensues


On the surface, giving 5th-graders sugar cubes seems like a terrible idea. But BJ Barrie, a math and science teacher at Euper Lane Elementary School in Fort Smith, Arkansas had her reasons. Chief among them was Barrie’s goal to help students realize they’re capable of making sense of the world on their own.
Barrie was in the midst of a unit on matter. She’d challenged her students to investigate how temperature affects solubility (hence the sugar cubes). Instead of giving the students step-by-step instructions for carrying out the experiment, she left it open-ended, giving them occasional prompts to keep them thinking as they figured out what would work on their own.
The Challenges of Doing Science in Elementary School
At the beginning of the year, Barrie’s students often asked her to explain why things happened, expecting that they’d just be told. They didn’t trust themselves to figure out the phenomenon; they didn’t know the steps to take to do so. Barrie says this insecurity likely resulted from limited exposure to hands-on science.
“Some of the early elementary teachers have not had the time to hone in on science as much as they would like to,” explained Barrie.
They’re not alone. A 2021 report from the National Academies of Science, Engineering and Medicine revealed the average elementary student spends less than 20 minutes per day on science.
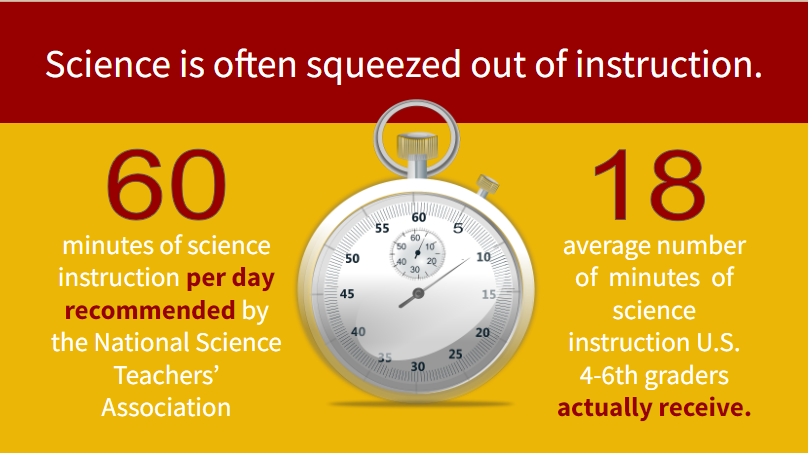
Science and social studies are often squeezed out of the elementary curriculum due to time pressures from other subjects. Increasingly rigorous and frequent standardized testing in English language arts and mathematics results in these subjects being prioritized.
Some school systems attempt to address the dearth of science instructional time by having students read non-fiction texts about science during their literacy block. Passive methods of relaying content information, like reading and watching videos, fall short of teaching students science practices, however.
“Why Do You Think That Happened?”
Barrie’s goal is to graduate 5th-graders who know how to apply the science practices to make sense of phenomena on their own. Hence her mantra: “Why do you think that happened?” This short phrase both turns her students’ attention back to the investigative process and imparts her trust in their ability to figure it out.
“With hands-on experiments, students directly observe phenomena and manipulate variables,” explained Barre. “They develop a deeper understanding of scientific principles by seeing how theories apply in real-world situations.”
Data plays a key role in helping Barrie’s students generate claims in response to her oft-asked question, “Why do you think that happened?” When no one is giving them the “answer”, they need to turn to the data to find out what might be going on. (Ahem- sort of like professional scientists do.)
For example, during the sugar cube experiment, there were three people who dissolved the cube in less than a minute. Barrie encouraged her students to look closely at the class-wide data. What was the difference?
Tuva Jr. Helps Elementary Students Make Sense of Their Data
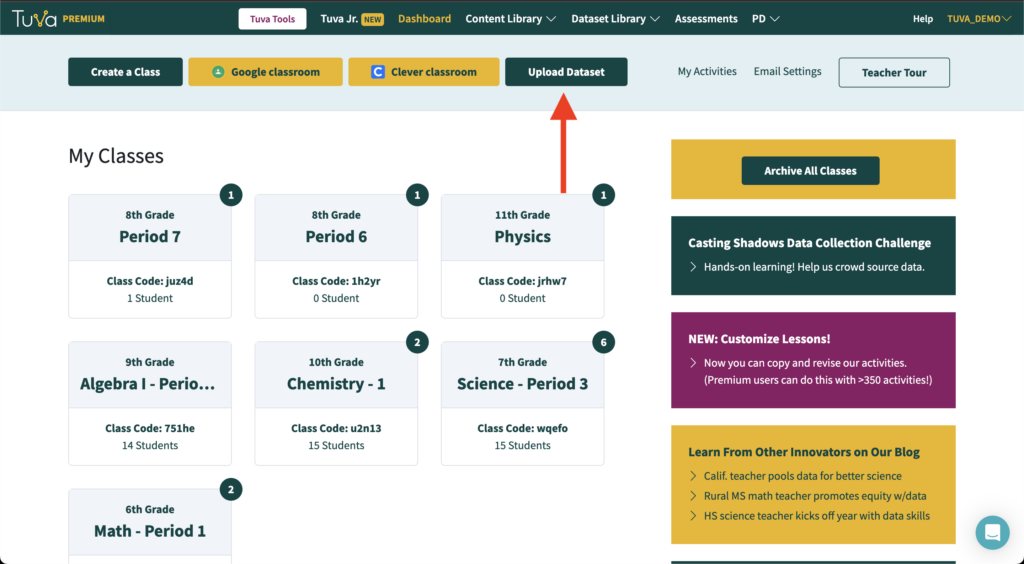
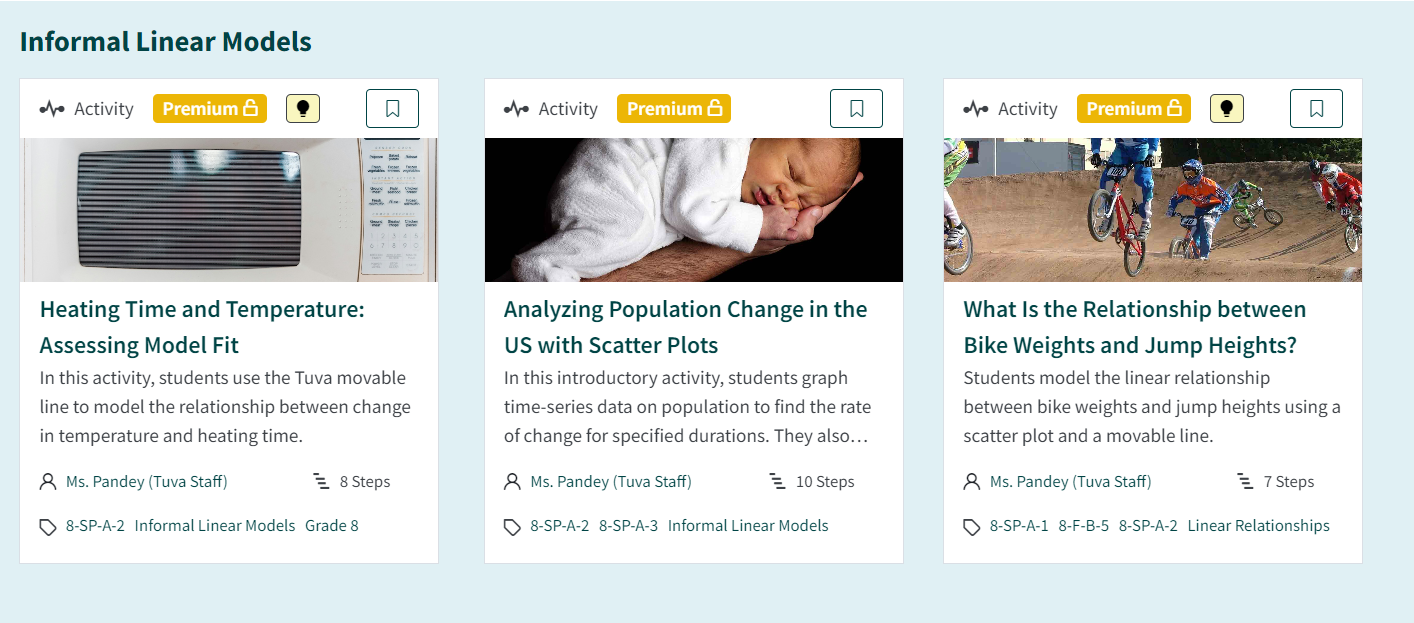
When sensemaking happens through hands-on experimentation, students must be equipped with the skills necessary to interpret and analyze the resultant data. Like other skills, data literacy must be taught. In Barrie’s classroom, students have built up these data literacy muscles using Tuva Jr., Tuva’s new program designed for kids in grades 3-5. Barrie participated in the Tuva Jr. pilot program earlier this school year and has been a regular user since.
Barrie said she loves Tuva Jr. because “students not only learn data analysis but also discover the power of curiosity and critical thinking.”
Barrie said the playful nature of the Tuva Jr. tools appeals to her students. Like Tuva, the graphing interface uses interactive drag-and-drop technology, making it easy for students to choose which attributes (variables) they want to explore. Students can also choose from a menu of graph types. These are our tried and trusted features that place students in the driver’s seat in a way that can’t happen with static data tables and graphs.

But Tuva Jr. also has unique features. It opens in “Play View” where each case is represented by a playing card, and when users switch to the “Plot View” the data points retain a playful shape, such as that of a football or a koala. Additionally, to prevent overwhelming younger students, the toolbar is simplified and the overall number of attributes and cases is smaller.
Relevance is another strong suit of Tuva Jr., according to Barrie.
“I like how Tuva has content about different things that would be interesting to my students,” said Barrie.
So far, her kids’ favorite Tuva Jr. activities include Comparing Candy and Beach Cleanup. While the candy-themed activity was a fan favorite for obvious reasons, the litter dataset prompted their intellectual curiosity. Knowing that this data was real deepened the conversation. Beach Cleanup launched a wide-ranging discussion about what is considered junk, how certain items could have found their way to the beach, and how plastic never really goes away. Barrie’s students were surprised by how much junk was found on the beach and were inspired to think of strategies for preventing plastic waste that can be carried by wind or water to the water’s edge.


The Case for Giving 10-Year-Olds Sugar Cubes
Our world is a complex place. There’s an unspeakable complexity in nature- in the structure of a glucose molecule or in the creation of a cumulus cloud, for example. And there’s immense complexity in the world’s latest problems, like garbage islands and nanoplastic pollution. When our kids are all grown up and tackling their own generation’s conundrums, they’ll need to ask themselves, “Why do we think that happened?”, and they’ll need to have the capability to gather and analyze data to help them get closer to the answer. That capacity does not just suddenly emerge at a certain age; it has to be built up gradually.
While the potential short-term consequences of giving a room full of 5th-graders sugar cubes loom large, the consequences of not entrusting them with decision-making power while we still have the opportunity to nurture and direct those powers is far greater. BJ Barrie has the long game in mind.