Tuva Redoubles Commitment to Integrating Data Literacy Across the Math Curriculum

Math Content Library Revamp First Step in a Larger Effort to Support Teachers

Calls to incorporate data literacy in K-12 education are gaining momentum across the country. States like Virginia, Utah, Oregon, and California are taking major steps to create updated state standards or dedicated high school pathways.

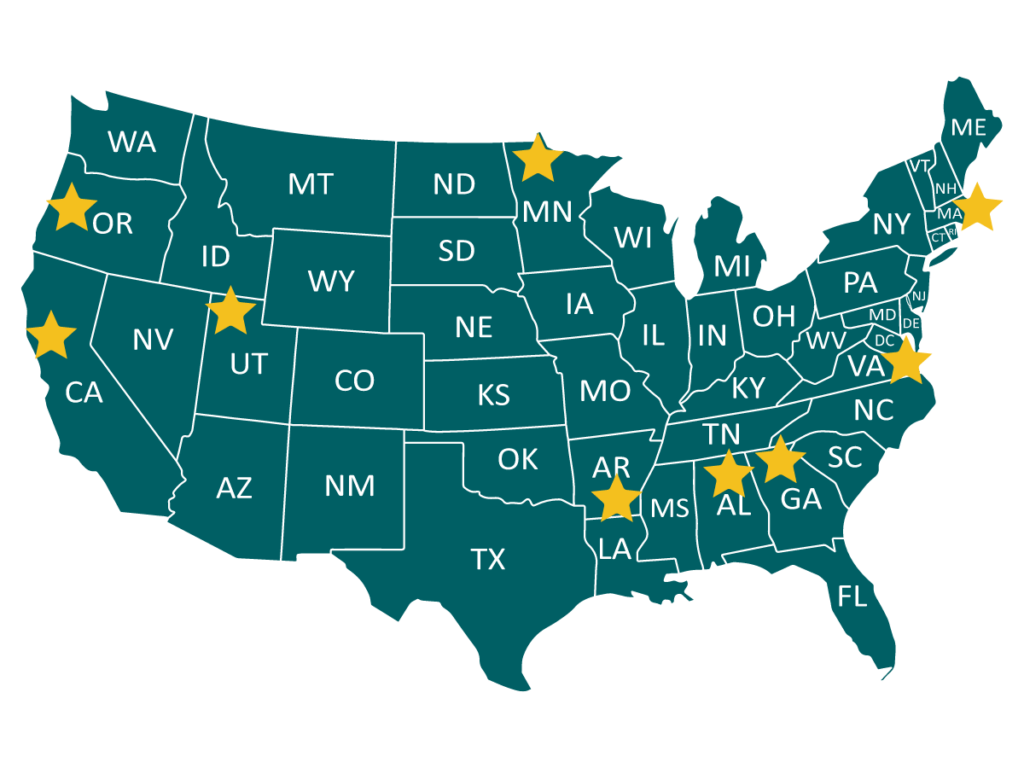
Some of the states who’ve recently incorporated data literacy into their standards.

As a company dedicated to building a future in which all students possess data literacy and use it to contribute positively to society, Tuva applauds these changes. We also recognize implementing change takes work. Teachers, schools, and districts deserve support as they work to integrate data literacy across their math curriculum. To help maintain the momentum, Tuva is placing renewed energy on its resources for mathematics teachers.

As part of this effort, we recently revamped our math content library to make it easier for math teachers to locate lessons that will help them weave more data into their curriculum. The library has been reorganized to better reflect what teachers are teaching, with separate pages for each course.

“We’re hoping these changes will enable our math teachers to spend less time searching and more time teaching,” explained Tuva Math Educational Specialist  Colleen McEnearney.

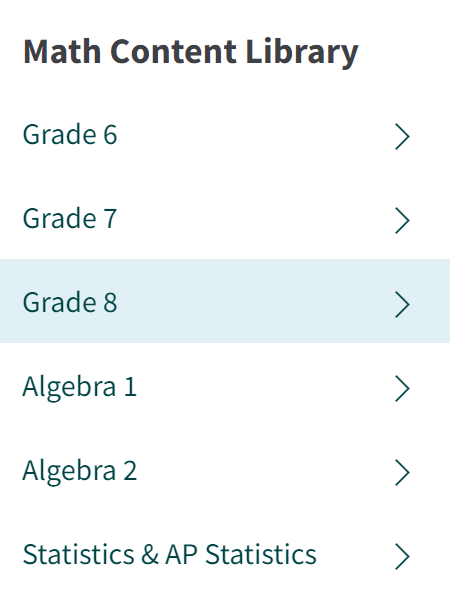
The content in the library has not changed; the navigation system has. Teachers are prompted to select a course: 6th-grade math, 7th-grade math, 8th-grade math, algebra 1, algebra 2, or statistics/AP statistics. 

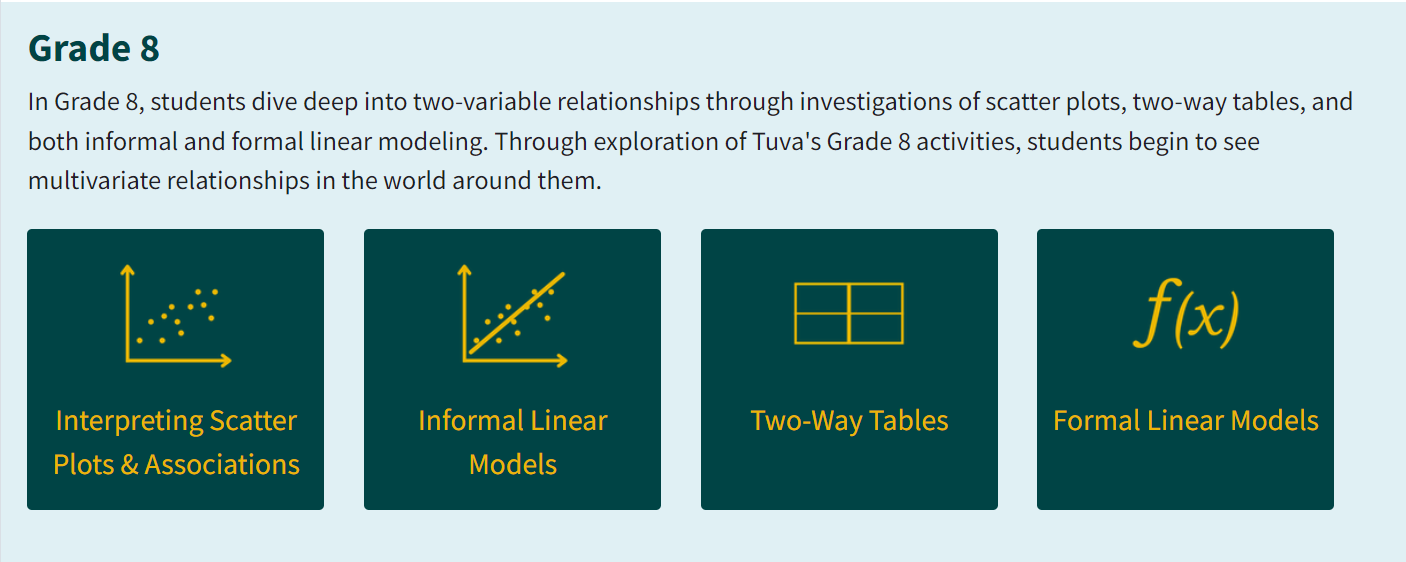
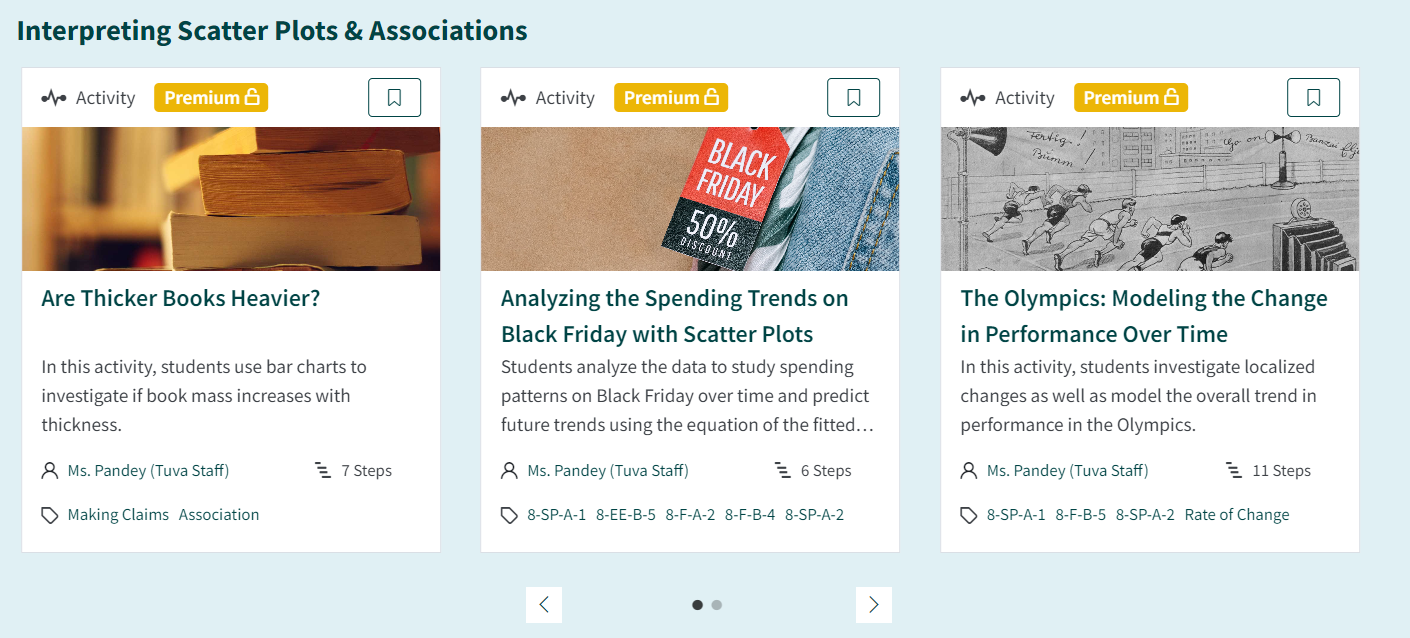
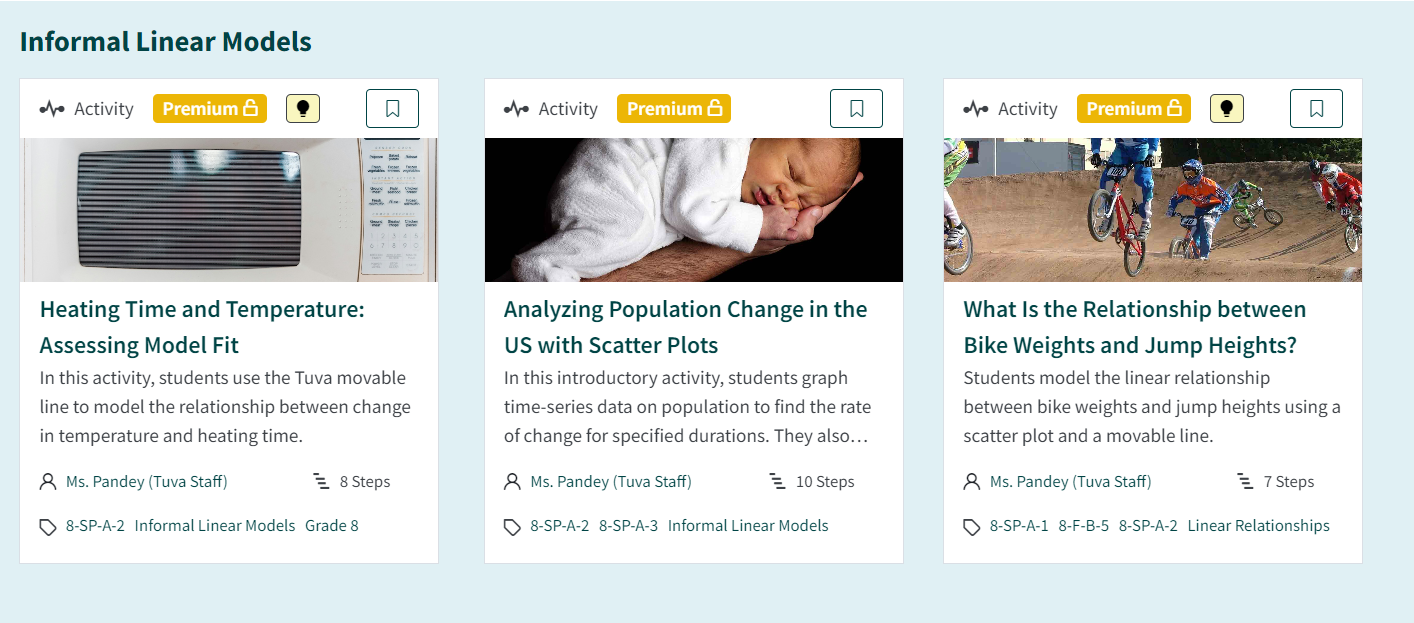
Each course page is divided into the big ideas of that course. These big idea buckets represent areas within each course where real-world data can greatly enhance students’ understanding of the content. For example, the 8th-grade math page includes the big ideas: interpreting scatter plots and associations; informal linear models; two-way tables; and formal linear models.

All lessons connected to a big idea are clustered on the page, so teachers can scroll through them all at once. 

Previously, teachers had the option to sort lessons by course or concept, but this posed challenges. When filtering by course, they would see all lessons related to the course’s standards, requiring manual searching for specific concepts. Searching by concept, while possible, often resulted in diverse grade-level materials, necessitating manual sifting for grade-appropriate content within the old organizational system.

Tuva’s math content library revamp eliminates these time-consuming issues and makes finding the just-right lesson much more efficient. Explore our newly remodeled math content library

Rural Math Teacher Uses Real-World Data to Promote Equity

Nate Sebold Champions Authentic Data to Surface Social Justice Issues and Boost Inclusion

One of the things Putney, Vermont, teacher Nate Sebold loves about middle school students is that they are full of questions. He considers it his job to “harness” those questions and give kids the tools they need to answer them. For Sebold, that means having students interact with data.   

“How to interpret data, how to question data sources, how to investigate data – these are increasingly important for today’s 13-year olds.  Data is going to be such a huge part of their lives,” said Sebold.  

According to Sebold, contrived data won’t cut it. He prefers to use real-world data. His reasons are twofold: social justice and classroom inclusivity.  

Surfacing Social Justice Issues with Data

Sebold experienced an aha moment at a National Council of Teachers of Mathematics conference.  The presenter pointed out that teachers make a choice when they place a graph in front of students. The graph can be about something socially relevant, or not.  Since then Sebold selects data carefully with an eye to surfacing important social justice issues. For example, Sebold regularly uses the Tuva activity Incomes of Men and Women in the US: Comparing Groups with Box Plots. Sebold said that introducing relevant data, like this dataset, in the classroom creates a space for students to ask questions and increases classroom dialogue.  

Boosting Inclusion by Helping Student Connect Personally to Data

Another advantage of real-world data, Sebold said, is that it benefits students with learning differences.

Before taking the job at Putney Central School in 2022, Sebold spent a number of years as math department head at the Greenwood School, a small college preparatory school for students with learning differences. He and his science colleague noticed a real difference in conceptual understanding of data when students had collected it themselves.

“When they would sort it… they would say, ‘there’s my point in the midst of all the others!’  The data meant something.”

Sebold explained that when students saw that the graphs were not just randomly created, but made up of points of data they had collected, it helped them comprehend that all graphs are made up of individual data points. Data visualizations became more concrete.

In one project, Sebold’s students entered their own demographic data into Tuva. Sebold notes students’ comprehension of graphs increases when they help with the data collection process.

“When we pulled the data up on Tuva, they would try to find their own response, their data point.  Then, when they would sort it or organize it, they would say, ‘there’s my point in the midst of all the others!’  The data meant something,” Sebold said.

Inspired? Surface social justice with these resources.

Introducing the Model Shop – Enabling Students to Learn Modeling

From the CCSS Standards of Mathematical Practice – Modeling with Mathematics practice:

“Mathematically proficient students can apply the mathematics they know to solve problems arising in everyday life, society, and the workplace. In early grades, this might be as simple as writing an addition equation to describe a situation. In middle grades, a student might apply proportional reasoning to plan a school event or analyze a problem in the community. By high school, a student might use geometry to solve a design problem or use a function to describe how one quantity of interest depends on another.” 

From the High School Common Core Standards on Modeling:

“Modeling links classroom mathematics and statistics to everyday life, work, and decision-making. Modeling is the process of choosing and using appropriate mathematics and statistics to analyze empirical situations, to understand them better, and to improve decisions.”

From Science and Engineering Practice in the NGSSDeveloping and Using Models practice: 

“Models include diagrams, physical replicas, mathematical representations, analogies, and computer
simulations. Although models do not correspond exactly to the real world, they bring certain features into
focus while obscuring others. All models contain approximations and assumptions that limit the range of
validity and predictive power, so it is important for students to recognize their limitations.” 

Building on our Signs of Change content initiative that brings history and mathematics together for students, we are excited to announce the Model Shop, our next math and science content initiative dedicated to an incredibly important concept – Modeling.

The Model Shop contains Tuva datasets and activities that enable your students to build a strong foundation about Modeling. Students get an opportunity to use elementary, linear functions to make mathematical models of real data. 

Through our activities and lessons, students will get an opportunity to answer the following questions – What is a mathematical model? How is a mathematical model developed? How does the mathematical model represent our reality, and what is the meaning behind the curve and the parameters? 

We are starting the Model Shop initiative with linear models, giving students an opportunity to create a model for data related to a pencil sharpener, book pages and thickness, Chinese trains, Hooke’s law, and others. Over time, we will continue to add datasets and activities beyond just linear models, including logarithmic, quadratic, exponential, and others. 

All the Tuva Datasets and Activities in the Model Shop are fully accessible only to Tuva Premium customers. Learn more about Tuva Premium here or get in touch with us directly.