Tuva Redoubles Commitment to Integrating Data Literacy Across the Math Curriculum

Math Content Library Revamp First Step in a Larger Effort to Support Teachers

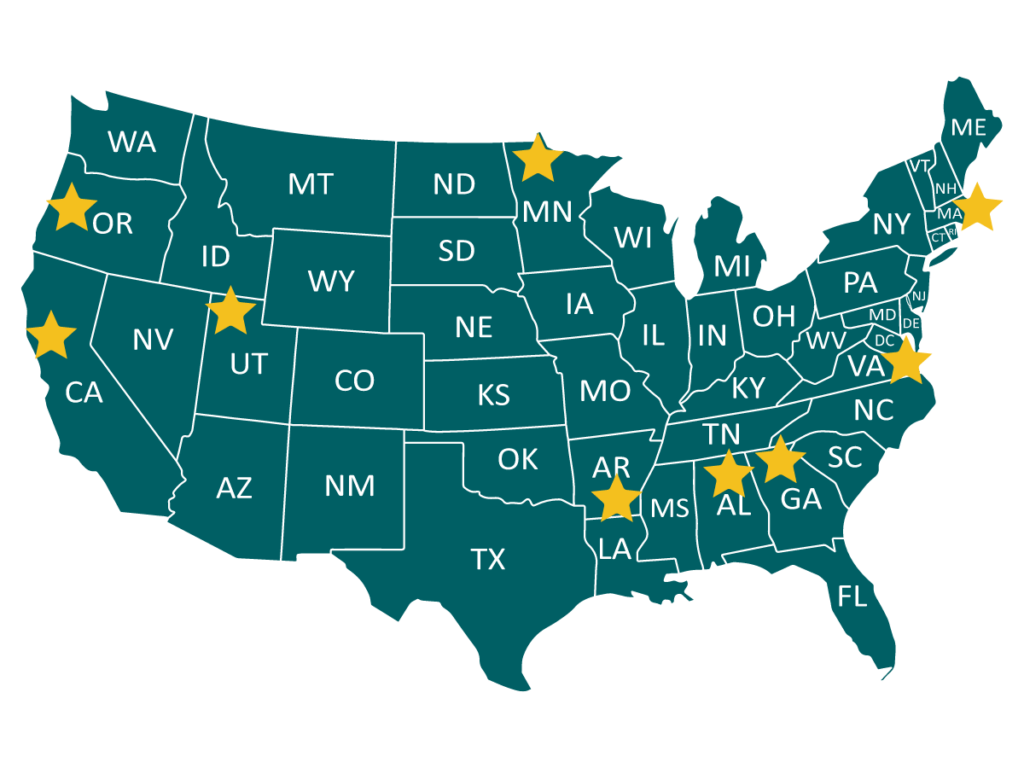
Calls to incorporate data literacy in K-12 education are gaining momentum across the country. States like Virginia, Utah, Oregon, and California are taking major steps to create updated state standards or dedicated high school pathways.

Some of the states who’ve recently incorporated data literacy into their standards.

As a company dedicated to building a future in which all students possess data literacy and use it to contribute positively to society, Tuva applauds these changes. We also recognize implementing change takes work. Teachers, schools, and districts deserve support as they work to integrate data literacy across their math curriculum. To help maintain the momentum, Tuva is placing renewed energy on its resources for mathematics teachers.

As part of this effort, we recently revamped our math content library to make it easier for math teachers to locate lessons that will help them weave more data into their curriculum. The library has been reorganized to better reflect what teachers are teaching, with separate pages for each course.

“We’re hoping these changes will enable our math teachers to spend less time searching and more time teaching,” explained Tuva Math Educational Specialist  Colleen McEnearney.

The content in the library has not changed; the navigation system has. Teachers are prompted to select a course: 6th-grade math, 7th-grade math, 8th-grade math, algebra 1, algebra 2, or statistics/AP statistics. 

Each course page is divided into the big ideas of that course. These big idea buckets represent areas within each course where real-world data can greatly enhance students’ understanding of the content. For example, the 8th-grade math page includes the big ideas: interpreting scatter plots and associations; informal linear models; two-way tables; and formal linear models.

All lessons connected to a big idea are clustered on the page, so teachers can scroll through them all at once. 

Previously, teachers had the option to sort lessons by course or concept, but this posed challenges. When filtering by course, they would see all lessons related to the course’s standards, requiring manual searching for specific concepts. Searching by concept, while possible, often resulted in diverse grade-level materials, necessitating manual sifting for grade-appropriate content within the old organizational system.

Tuva’s math content library revamp eliminates these time-consuming issues and makes finding the just-right lesson much more efficient. Explore our newly remodeled math content library

Thank you for your data stories Professor Hans Rosling

Yesterday a data visionary, public educator, and storyteller Professor Hans Rosling passed away in Uppsala, Sweden.

Dr.Rosling was a professor of global health at Sweden’s Karolinska Institute. He founded the Gapminder Foundation in 2005, and decided to dedicate his time and energy to use data and statistics to debunk myths and provide a truer picture of our world.

In his 10 TED Talks — the most ever by a single person — he addressed critical global issues such as population growth, child mortality, poverty, and many others through the lens of data and simple statistics.

There has never been a more important time to enable our students and future global citizens to think critically about information, ask questions, use data as evidence, and have the ability to make sense of data and statistics they encounter every day.

All of us at Tuva have been greatly inspired by Professor Rosling’s vision and work, and in his passing, we are doubling down on our mission to make data and statistics accessible and usable for all.

Thank you Professor Hans Rosling, for your data stories and all your inspiration!

Sincerely,
The Tuva team

Tuva in an EdTech Research Session at the New Schools Summit

Tuva is excited to participate in a session alongside WestEd and NSVF Ignite on EdTech Research that Empowers Educators and Entrepreneurs at the New Schools Summit in San Francisco on May 11, 2016.  

Other participant teams in this session include: Distinctive Schools, Rocketship Education, Lexia Learning, Proving Ground Project at Harvard Center for Education Policy Research, and MIND Research Institute

It promises to be a fantastic session, exploring the paramount topic of how rigorous education research can inform the design and development of tools and products to drive more effective teaching and learning in the classroom. 

Are you planning to be at the New Schools Summit? If yes, please join us at the session. 

Coming Soon – Automatic Grading on Tuva!

During the initial design phase of Tuva Activities and Lessons, one critical decision we made was that activities on Tuva would only initially support one item type – open-ended questions.

Why? We felt that activities and lessons based on authentic datasets gave both educators and learners a unique opportunity to look beyond the straightforward multiple-choice and True/False questions. 

With actual data and tools at our fingertips,  educators can pose a number of interesting, open-ended questions that gave learners an opportunity to:

  1. Practice and gain exposure to the language of data, statistics, and graphing.
  2. Construct arguments and support their reasoning with evidence from the data and their own visuals.
  3. Explain their thinking in words, giving them an opportunity to focus on their grammar, sentence construction, as well as learn the techniques of quantitative reasoning.
  4. Describe in words the various aspects of the data, including:
    1. Any patterns or interesting phenomenon they discover.
    2. Distribution of various attributes, such as its shape, its spread, or its center

                                        Image: New Item Type on Tuva

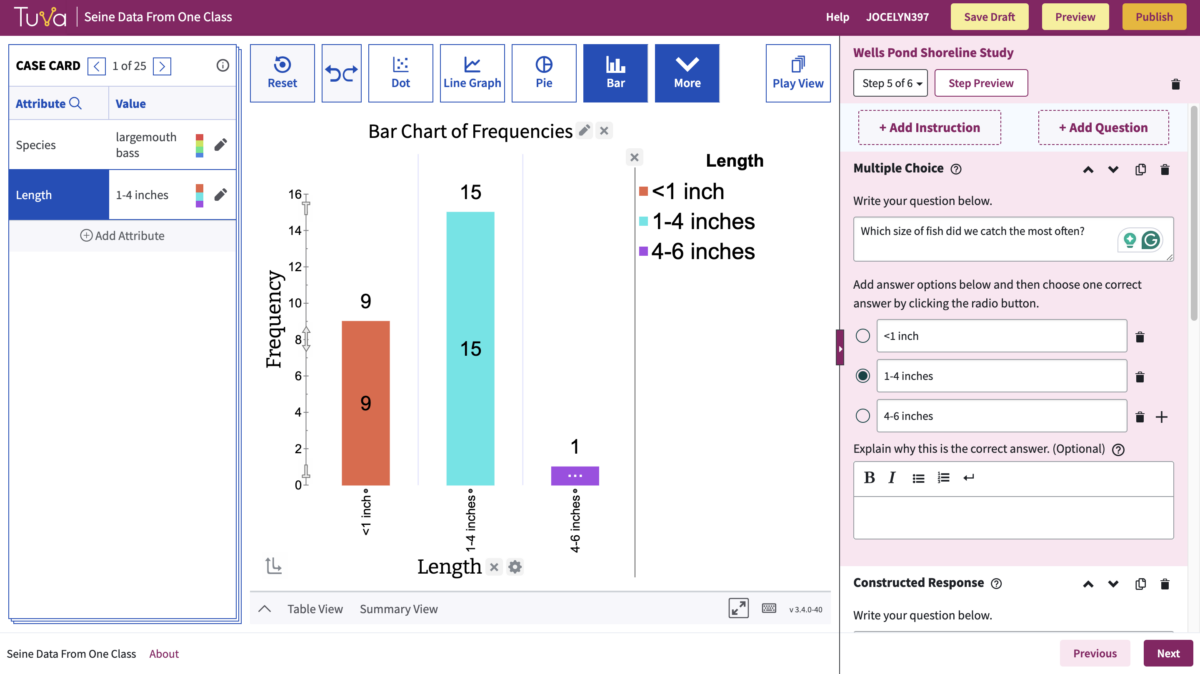
Over the last twelve months, we have received a variety of feedback from educators across math, science, statistics, and many other subject areas about being able to ask (and immediately grade) straightforward, multiple-choice questions at the beginning of the activity to assess for basic understanding, and then gradually build towards the more difficult, open-ended questions.

I am excited to announce that we will soon be adding these two new features – Multiple Choice Questions and Automatic Grading – to Tuva Activities and Lessons.

For Tuva Basic teachers, you will be able preview these new features via a number of different activities on the 25 Free Tuva Datasets.

For Tuva Premium subscribers, you will see this feature gradually introduced across all of our 400+ activities and lessons around 315+ datasets, as well as many of the new activities and lessons we release moving forward.  

Introducing Tuva Collections

At Tuva, our goal is to make data accessible and usable for data novices and learners, enabling them to learn and master foundational data, statistics, and analytical concepts and skills.

The Open Data Movement has catalyzed something incredibly powerful – free, open access to millions of datasets from a vast number of organizations such as the World Bank, NIH, NASA, CDC, NOAA, FDA, Census Bureau, Department of Education, Department of Energy, and many many others. 

We believe that these open datasets can serve a powerfully unique purpose. These datasets can be transformed into opportunities for deep inquiry, exploration, and learning. They enable educators to teach and students to learn critical data exploration, visualization, analysis, and interpretation, as they dig deeper into topics aligned to their curricula and standards, their interests, or their day-to-day work.  

To continue to realize on our vision, we are excited to formally announce the launch of Tuva Collections! 

What is a Tuva Collection?

A collection is a group of ready-to-use datasets, activities, and lessons around a specific content area (such as Linear Models) or topic (such as Social Justice). 

How many collections are on Tuva?

Currently, we have 4 Tuva Collections (and plenty more in the works!). They are:

1. Signs of Change – Discovering events and phenomena in US History using US Census Microdata

2. The Model Shop –  Using data to learn about Linear Models

3. Civic Literacy Through Data – Explore social issues including gender equality, gender identity, immigration, and racial justice in the United States through the lens of data

4. Employment in NYC – Exploring Employment in NYC through the lens of the 5 Boroughs, Race, Educational Attainment, Gender, and many other factors

Are you open to collaborations to create a new Tuva Collection?

Yes – we have many more Tuva Collections in the works so please stay tuned! 

We are already working with organizations such as Democracy Prep Public Schools and NYC Department of Education to design and produce our Tuva Collections. 

If you are interested in collaborating with us to create a Tuva Collection, please reach out to us at hello@tuvalabs.com