Data Visualizations Make the Invisible Visible for Hands-on Learners

View from the Classroom
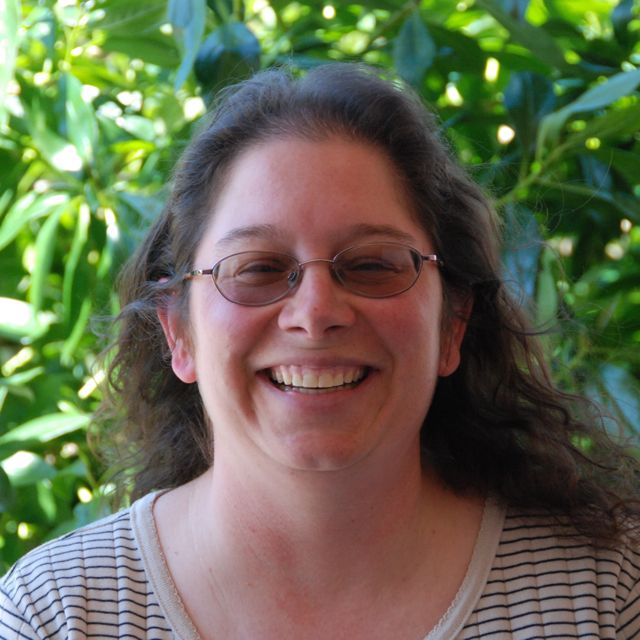
Catia Wolff in her classroom.

A strand of human DNA is a mere 2.5 nanometers wide. To put that in perspective, a sheet of printer paper is 100,000 nanometers thick. It’s no wonder high school microscopes are not powerful enough to enable students to view DNA! That poses a challenge for high school biology teachers, though. Anything at such an infinitesimal scale is abstract. It’s quite the trick to teach about how structure relates to function for something none of the students have ever seen. 

High school science teacher Catia Wolff recognizes the need to make genetics more concrete for her students. This is especially true because of the population of students in her classes.

“Our school attracts students that prefer working on hands-on projects rather than a traditional setting,” explained Wolff.

Wolff teaches at the Rockland BOCES Hudson Valley Pathways in Technology Early College High School, more commonly referred to as Hudson Valley P-TECH. The program is part of the larger New York State P-TECH Program initiated a decade ago with dual goals of preparing students for high-skill, high-wage STEM jobs and ensuring employers have access to a talented and skilled workforce. Students who complete the program at Hudson Valley P-TECH graduate with both a high school diploma and an associates degree at Rockland Community College.  The school tends to draw students with a talent for and affinity toward working with their hands. 

Hudson Valley P-TECH attracts students who are hands-on learners.

Wolff carefully selects and sequences lessons to make genetics more tangible. Her process starts with three-dimensional modeling. She gives her students a DNA sequence. Students create a complementary DNA strand. Then they model the processes of transcription and translation, simulating how a cell carries out protein synthesis.  

After completing this process, Wolff found her students were still struggling to understand how all the cells in our body can have such drastically different characteristics while housing identical DNA. They didn’t understand what gene expression means. They needed something more. What Wolff did next did not surprise P-TECH Guidance Counselor Allison Paul. 

“Tuva caught my eye right away. Students can see it, they can manipulate it. They can do it. They’ll say, ‘Look what I made!’”

“She is always learning. When most teachers just want to take the summer off, she is taking a course. She is constantly learning and constantly trying to improve,” said Paul.

Instead of adding in a lecture, reading or video, Wolff began searching for resources that would cater to her students’ learning style. What she found was Tuva’s activity Genes: To Express or not to Express? That is the Question

The activity uses a dataset curated from The Human Protein Atlas, a Swedish-based program with the aim to map all the human proteins in cells, tissues, and organs. Tuva’s dataset includes 35 different genes, the function of the proteins they code for, and whether or not those genes are expressed in the tissues that make up the eye, skeletal muscle, stomach and tongue. During the activity, students look for patterns of gene expression and hypothesize an explanation of the results.

“They had to figure out the puzzle. It made them really think. It really sparked conversation,” said Wolff

This dot plot shows the genes expressed in two different tissues: skeletal muscle and stomach. It has tissue type on the x-axis and gene name on the y-axis. The legend shows the function of the proteins created by the genes. Students can see that four genes are expressed in skeletal muscle that are not expressed in stomach tissues.


Throughout the course of the activity, students use Tuva’s drag and drop graphing tools to create visuals that help them compare the tissues and puzzle out why some tissues express certain genes while others do not. Wolf observed that having a model, a graph that students could actually see and manipulate, helped them comprehend how DNA connects to cell function. 

“Tuva caught my eye right away,” Wolff explained. “Students can see it, they can manipulate it. They can do it. They’ll say, ‘Look what I made!’”

Fostering Systems Thinking in the Middle Grades 

View from the Classroom

Foley Teaches Complexity Using Multivariate Graphs

Downpours in Uruguay, but drought in Peru.  Enormous blizzards in the northeast,  but steeply climbing worldwide temperatures. Climate science can be confusing… especially if you’re only 14 years old.  Without an understanding of complex  systems, it can seem downright contradictory. 

That’s why Maura Foley, an earth and climate science teacher at the Hopkins School in Connecticut, devotes significant energy to helping her students investigate systems interactions.

“Today’s problems are complex problems, so we need thinking that is going to reach outside of these discrete zones of understanding,” said Foley. 

Foley admits that  understanding complexity is part of higher order, abstract thinking – an easier task for her high school students than her middle school students. However, she believes it’s essential to begin building the idea of complexity in the lower grade bands. In her middle school courses, the process of building that understanding starts with noticing how one thing affects another, which affects another, and so on. 

“Today’s problems are complex problems, so we need thinking that is going to reach outside of these discrete zones of understanding.”

“What’s great about Tuva is being able to blow through looking at a whole bunch of variables quickly,” explained Foley. “They don’t need to be a spreadsheet expert to quickly go ahead and make 10 graphs.” 

Foley uses Tuva activities and datasets consistently throughout her Surface to Space class in 8th-grade. Each dataset includes multiple, interconnected variables that students can drag and drop onto the axes to explore correlations.

Global Change Dataset Image
October Weather in US Cities Datset Image
New England Ice-Out Dates, Global Change and October Weather in US Cities are a few Tuva datasets Foley’s students use to explore complex earth and climate systems.

When students first use Tuva, she said there tends to be some oohs and aahs as they watch the dots rearrange themselves. Then, Foley starts to hear students verbalizing the patterns they observe.

“Those observations are able to keep going and going because it’s not like I’ve handed them a simple graph,” said Foley.   

Graph Showing Positive Relationship Between Humidity and Particulate Matter
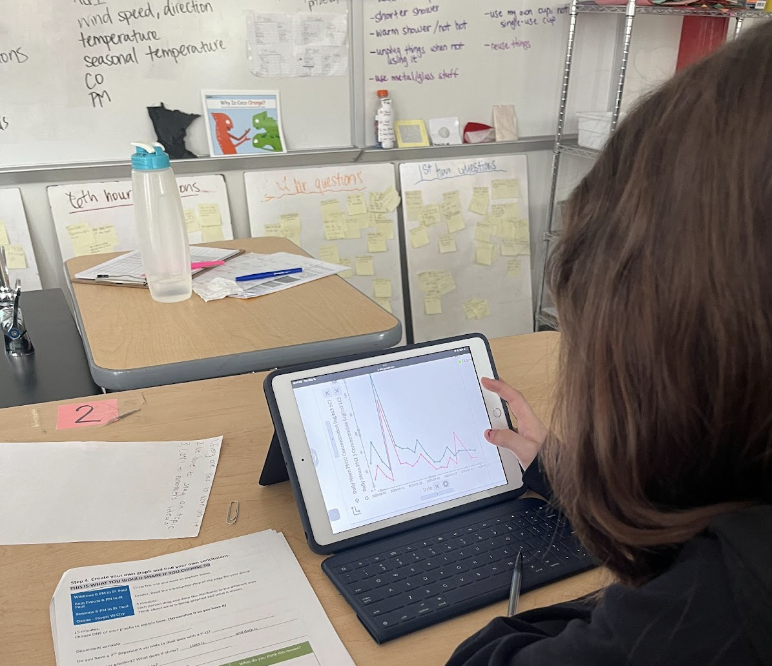
This graph, created by an 8th-grader in Foley’s class, investigated the relationship between particulate matter and humidity.

Foley has observed that once students notice one relationship, they begin to wonder if other variables are related. Tuva allows them to quickly and easily satisfy their curiosity. It starts a deeper conversation in which students begin to comprehend the complexity of Earth’s systems. 

In addition to middle school science, Foley teaches a high school elective: Engineering Nature. In this higher level class, Foley expects her students to apply their understanding of interconnectedness to tackle pressing issues, such as climate change. Last year her students made biogeochemical terrariums and tracked CO2 concentrations over time. Then they geoengineered the terrariums to reduce the CO2 concentrations.

Foley’s emphasis on interconnected systems when these students were in the middle grades prepared them to take on this rigorous geoengineering challenge. In the long term, Foley‘s students will be prepared to face the complex problems of a complex world.

Accentuating the Power of Shared Data

California Teacher Spiri Bavelas Trains her Students to Know Their Way Around Messy Data

Working with data becomes second nature to students in Spiri Bavelas’ science classroom. Whenever they are completing an experiment in her class, students collect their own data and put it into a shared, class-wide spreadsheet. Then, Bavelas uploads the data into Tuva where students can manipulate and explore it. When Bavelas uses larger, messy datasets, she’s drawing from her years as a research assistant before she began teaching.

“You never are going to look at just five numbers in the real science world.”

“When I started, students collected four or five numbers and were supposed to come up with a big conclusion, but you never are going to look at just five numbers in the real science world,” she said. 

Bavelas has worked in a handful of different schools throughout California, but recently took a position at R. Roger Rowe Middle School in Rancho Santa Fe. Wherever she has been, Bavelas has engaged her students with large data sets. 

One of the lessons she hopes to impart to her students is that people can use data to make better decisions. Bavelas used a popular mining simulation to illustrate this concept during an environmental resources unit. Students placed cookies on grid paper and mined the chocolate chips, keeping track of expenses and income. Afterward, she instructed them to measure damage to the environment based on the number of grid squares where crumbs landed. By analyzing all of the data pooled from Bavelas’ classes, students gained insights into which mining strategies caused minimal harm, enabling them to develop new, environmentally-friendly, yet still profitable, methods of extraction.

Bavelas’ students use Tuva to generate graphs that include data from all of their classmates.

Bavelas also showcased the utility of collective data during an annual egg drop competition at one of her former schools. Engineering teams were awarded points for landing crafts that had a slow descent, hit the target, and kept the egg safe. Bavelas had been collecting egg drop data over multiple years. Students used the data from prior years to inform their design decisions. For example, the data revealed that a light lander is advantageous, but only up to a point. If the device is too light, it drifts off target.

“Data analysis is not just something you can do in one class,” Bavelas said. “Data can be a thing on a larger scale where you can collaborate with people that are not right next to you.”

Bavelas also wants her students to be aware that data displays can be manipulated to suggest certain conclusions. For example, she explained, if you look at a bar graph and zoom in on the differences it might look like the more massive car travels down a ramp faster. However, when you look at it on a larger scale, the difference is tiny, and calculations reveal there is no statistical correlation between mass and speed.

Whether it’s understanding the importance of sample size, utilizing data to make good choices, or being savvy enough to detect deceit, Bavelas hopes the lessons students learn in her science class will serve them well in whatever path they choose.

“I want the skills students obtain in science class to be a vehicle for better understanding and functioning in the entire world.”

Introducing the Second Tuva Science Collection — Atmosphere

“Have lights when other men are blind

As pigs are said to see the wind”

Aside from Ralph Waldo Emerson’s claim (paraphrasing William Butler), of all Earth systems, the atmosphere can be one of the hardest for (non- pig) students to perceive.

Although we breathe in atmosphere every minute, its chemistry, layers, air masses, and patterns of movement occur at large scales and are often invisible.

We can feel the wind, but how can we discern its large-scale geographical and temporal patterns? Through data, of course!

Following up from the release of our first Tuva Science Collection on Earth in Space,  today we are excited to introduce Tuva’s second science collection – Atmosphere.

Typhoon Halong Seen from the International Space Station

The Atmosphere Collection includes datasets and activities that explore differences among vertical layers in the atmosphere, geographic variability in atmospheric pollutants, and temporal changes in components of the atmosphere such as the stratospheric ozone layer.

Some of the activities also explore weather and climate data to make sense of how air masses move.

Key ideas supported by datasets and activities in Tuva’s Atmosphere Collection include:

  • The size of the Antarctic ozone hole changes seasonally and is correlated with atmospheric concentrations of CFCs.
  • Atmospheric concentrations of CO2 and other pollutants have increased during recent decades, as has human population.
  • Relationships between different atmospheric parameters can be modeled and predicted mathematically.
  • Air masses can transport pollutants from source areas to distant non-source areas.  
  • Human actions to mitigate air pollution can improve air quality.

The activities support NGSS performance expectations, such as exploring evidence for how motions and interactions of air masses result in changes in weather conditions (MS-ESS2-5), or analyzing geoscience data to forecast of the rate of change in the ozone hole (HS-ESS3-5).

These activities also support a number of CCSS-Math standards such as modeling relationships with linear equations.

Don’t forget to give your students opportunity to explore data on their own to make their own discoveries. Help your students learn to “see the wind” — through data!

The Earth in Space and Atmosphere collections are available for Tuva Premium Subscribers.

Introducing the first Tuva Science Collection — Earth in Space

earth-rising

Here a star, and there a star,

Some lose their way.

Here a mist, and there a mist,

Afterwards — day!

Few have conveyed the beauty of dawn with more inspiration than Emily Dickinson. As teachers of Earth science, we aspire to convey to students appreciation and understanding of what it means to be a planet moving through space and how our position and movement in space predictably affects our everyday experience of, well — day!

The magnitude of spatial and temporal scale differences covered by the topic of “Earth in Space” makes it challenging to find datasets about stars, planets, Sun and Moon, orbits,  seasons, tides, and day-lengths that are of a scope that students can explore to find meaning and discover patterns and relationships.

At Tuva, we are gathering datasets into collections by topic to help you quickly find data and activities that support a unit you are teaching. Our first Tuva Science Collection is Earth in Space.

Tuva’s Earth in Space collection provides opportunities for students to analyze and interpret data and model systems (see NGSS ESS1.A and ESS1.B) to support understanding of key ideas such as:

  • Stars range in size, type, and distance from our Solar System.
  • Planets have different properties (density, gravitational pull, orbital period, temperature…)
  • Seasons occur at opposite times of year in northern and southern hemispheres.
  • The timing of tide cycles can be explained (and predicted) by the phase (and position) of the Moon.
  • How much day length changes through the year depends on latitude.

Each dataset has at least one activity, and you can add or adapt activities to fit your teaching goals.

Help your students discover and appreciate the music of the spheres — through data!

We will be adding many other science collections in coming weeks and months.  If there is a collection you are especially interested in, please let us know via Tuva Support or share with the community on Tuva Discussions.