Introducing the Second Tuva Science Collection — Atmosphere

“Have lights when other men are blind

As pigs are said to see the wind”

Aside from Ralph Waldo Emerson’s claim (paraphrasing William Butler), of all Earth systems, the atmosphere can be one of the hardest for (non- pig) students to perceive.

Although we breathe in atmosphere every minute, its chemistry, layers, air masses, and patterns of movement occur at large scales and are often invisible.

We can feel the wind, but how can we discern its large-scale geographical and temporal patterns? Through data, of course!

Following up from the release of our first Tuva Science Collection on Earth in Space,  today we are excited to introduce Tuva’s second science collection – Atmosphere.

Typhoon Halong Seen from the International Space Station

The Atmosphere Collection includes datasets and activities that explore differences among vertical layers in the atmosphere, geographic variability in atmospheric pollutants, and temporal changes in components of the atmosphere such as the stratospheric ozone layer.

Some of the activities also explore weather and climate data to make sense of how air masses move.

Key ideas supported by datasets and activities in Tuva’s Atmosphere Collection include:

  • The size of the Antarctic ozone hole changes seasonally and is correlated with atmospheric concentrations of CFCs.
  • Atmospheric concentrations of CO2 and other pollutants have increased during recent decades, as has human population.
  • Relationships between different atmospheric parameters can be modeled and predicted mathematically.
  • Air masses can transport pollutants from source areas to distant non-source areas.  
  • Human actions to mitigate air pollution can improve air quality.

The activities support NGSS performance expectations, such as exploring evidence for how motions and interactions of air masses result in changes in weather conditions (MS-ESS2-5), or analyzing geoscience data to forecast of the rate of change in the ozone hole (HS-ESS3-5).

These activities also support a number of CCSS-Math standards such as modeling relationships with linear equations.

Don’t forget to give your students opportunity to explore data on their own to make their own discoveries. Help your students learn to “see the wind” — through data!

The Earth in Space and Atmosphere collections are available for Tuva Premium Subscribers.

Introducing the first Tuva Science Collection — Earth in Space

earth-rising

Here a star, and there a star,

Some lose their way.

Here a mist, and there a mist,

Afterwards — day!

Few have conveyed the beauty of dawn with more inspiration than Emily Dickinson. As teachers of Earth science, we aspire to convey to students appreciation and understanding of what it means to be a planet moving through space and how our position and movement in space predictably affects our everyday experience of, well — day!

The magnitude of spatial and temporal scale differences covered by the topic of “Earth in Space” makes it challenging to find datasets about stars, planets, Sun and Moon, orbits,  seasons, tides, and day-lengths that are of a scope that students can explore to find meaning and discover patterns and relationships.

At Tuva, we are gathering datasets into collections by topic to help you quickly find data and activities that support a unit you are teaching. Our first Tuva Science Collection is Earth in Space.

Tuva’s Earth in Space collection provides opportunities for students to analyze and interpret data and model systems (see NGSS ESS1.A and ESS1.B) to support understanding of key ideas such as:

  • Stars range in size, type, and distance from our Solar System.
  • Planets have different properties (density, gravitational pull, orbital period, temperature…)
  • Seasons occur at opposite times of year in northern and southern hemispheres.
  • The timing of tide cycles can be explained (and predicted) by the phase (and position) of the Moon.
  • How much day length changes through the year depends on latitude.

Each dataset has at least one activity, and you can add or adapt activities to fit your teaching goals.

Help your students discover and appreciate the music of the spheres — through data!

We will be adding many other science collections in coming weeks and months.  If there is a collection you are especially interested in, please let us know via Tuva Support or share with the community on Tuva Discussions.

Introducing Data Literacy 101 course on Tuva

This blog post is written by Molly Schauffler. Dr. Schauffler is an Assistant Research Professor at the University of Maine School of Earth and Climate Sciences. 

Raise your hand if the idea of teaching your students data analysis and statistical thinking is a little unsettling for you.

For many of us who teach social studies, history, language arts, and (yes) even science, it has been a very long time since we took a course in statistics. For many, statistics is a scary label.

Even fewer of us have ever had training in how to incorporate statistical thinking into curriculum for young students. Yet assessments and standards expect our students to analyze and interpret data and make compelling arguments from evidence. Yikes.

The good news is that statistics educators and education researchers, and Tuva, promote an initial exploratory approach to learning how to think statistically about data. Research finds that students have lots to say about data once they have tools, opportunity, and guidance to explore data informally and reason about the stories they find.

Quantitative, or “Confirmatory” statistical analysis comes later, once students grasp challenges of making informal inferences about groups and attributes that are variable. 

In Exploratory Data Analysis, students first learn to recognize and talk about variability, and how variability and certainty are related. They learn to explore data, make informal claims, and develop language for describing their data.

If you feel hesitant about guiding students in data analysis, you are not alone. Many of you have asked for some kind of “orientation” for students starting out with data on Tuva. 

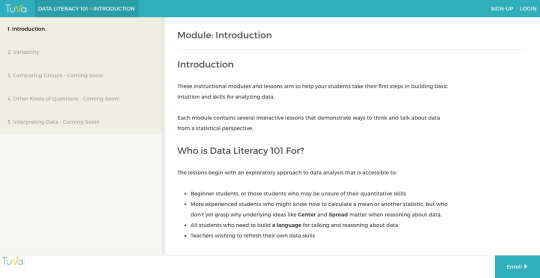
Today, we are excited to launch Data Literacy 101, a course with modules and lessons designed to establish fundamental exploratory data analysis skills (“Level I”).  

image

In the coming weeks, we will add lessons that scaffold students in more quantitative analyses (“Level II”), that then launch them into a grounded and integrated approach to analyzing data as evidence (“Level III”).

Data Literacy 101 lessons incorporate pre- and post-assessment questions to help identify gaps and gains in learning. Lessons are tagged to identify relevant data literacy standards. Follow-on activities will give students practice in skills just learned in a lesson using datasets tagged by content area. 

In addition to building students’ skills, Data Literacy 101 is a useful reference if you want to refresh your own familiarity with basic statistical concepts and tools and language.  

Data Literacy 101 can help you and your students experience the fun of playing with data and telling the stories they find. Let’s get started! 

More Updates to the Filter Bar

We have made additional updates to the Filter Bar on Tuva Datasets, following up from our announcement a few weeks ago regarding a more powerful Filter Bar. 

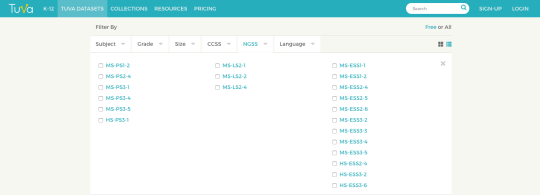
Now, you can filter for Tuva Datasets and activities by a specific Common Core Math Standard, Domain, or Topic.

The CCSS-related Filter categories include: Comparing Groups, Correlation, Comparing Data, Linear Equations, Modeling, Quantitative Relationships, and many topics and standards.

In addition, we are continuing to extend our coverage of the Next Generation Science Standards, and have curated a number of fantastic new datasets covering additional NGSS Physical Science, Life Science, and Earth & Space Science standards. To learn more, explore all the datasets in our Tuva Datasets Library

Remember, you can always reach out to us if you are unable to find a dataset for your needs. 

Introducing An Easier Way to Filter & Find Datasets on Tuva!

There are 300+ Tuva Datasets in our library covering topics such as the Climate Change, Land & Sea Animals, Presidents of the United States, and many many more.

Today, we are excited to do an initial launch of a more powerful Filter Bar to meet the diverse needs of our educators within the Tuva community.

A More Powerful Filter Bar:

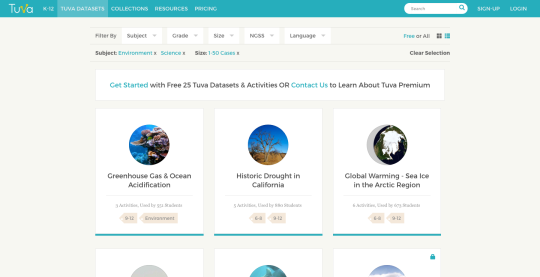
Now, if you wanted to find all the Science or Environment-related Tuva Datasets that are small in size, you can find them very quickly by choosing Science & Environment in the Subject drop-down and 1-40 in the Size drop-down, like this:

As you can see above, you can now filter and find Tuva Datasets based on a number of additional parameters beyond Subject & Grade Level such as:

  1. The Size of the dataset (How many data points are there?)
  2. The NGSS standard (particularly relevant for all our US Science Educators)
  3. The dataset Language (For our non-English speaking educators and learners)

Now, if you wanted to find all the Science or Environment-related Tuva Datasets that are small in size, you can find them very quickly by choosing Science & Environment in the Subject drop-down and 1-40 in the Size drop-down, like this:

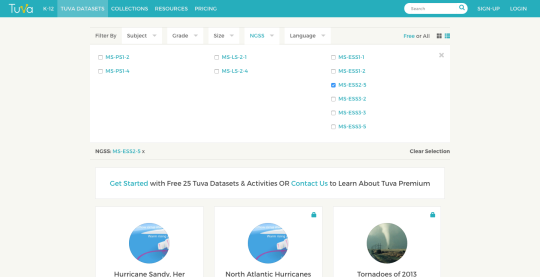
Or, if you wanted to find a dataset that is related to the MS-ESS3-5 (Earth & Human Activity) NGSS Standard, you can find it very quickly by choosing MS-ESS3-5 in the NGSS drop-down, like this:


Send Us Your Favorite Datasets & Win

Do you have a favorite dataset that you have used in your previous lessons or units? Does it come from an authentic source? Is it licensed under Creative Commons? Are you able to link to it?

Send us your favorite datasets to hello@tuvalabs.com over the next two weeks and enter a chance to win a Tuva T-shirt, a Tuva Coffee Mug, and other goodies!