Tuva recently launched a new feature that will significantly impact how students and teachers interact with Tuva Jr.: Live View.
Two Ways Live View Will Impact Instruction
1. Quickly Note Students Who May Need Your Attention
Some students constantly seek attention, while others do their best to fade into the background. Those who need your help most are not always the loudest.
Use Live View to identify students who:
are stuck or distracted
may be speeding through too quickly
2. Create a Dynamic, Responsive Learning Environment
Students thrive when teachers build opportunities for discussion, collaboration, and personalization. When you know where students are in a lesson in real time, you can:
pause them for discussion after they complete a specific question
partner them with others who have reached the same step
provide extensions for early finishers
Subscribe to Tuva or Tuva Jr. for Live View Access
With a Tuva subscription, you can monitor student progress on Tuva activities in real time with the new Live View feature. You’ll also get full access to our extensive library of lessons and datasets and unlimited capacity to upload data and create your own activities. View subscription information.
“It doesn’t really matter what you do. You can’t get away from data.
Chaffin Middle School Science Teacher Laura Davis recognizes data skills are in high demand in the modern workplace, and she wants her students to graduate prepared. Davis rapidly ticked off three local examples of data-driven careers.
Fort Smith, Arkansas, where Chaffin Middle School is located, is home to several big manufacturing companies including ABB Motors and Mechanical, Mars, Gerdau, Nestlé, Trane Technologies, The Coca Cola Company, and L’Oreal, amongst others. Davis noted that they don’t just need labor anymore; they need people who know their way around data because many of the diagnostic programs for the machinery run on data.
Additionally, many people in Fort Smith work remotely. The city has been recruiting remote workers to relocate to Fort Smith, luring them with monetary incentives. Many of the remote workers are in the information technology sector. Nationally, 67% of IT professionals work remotely, according to Statista.
Davis pointed out how even small businesses rely on data. Small business owners use data to optimize operations, manage inventory, improve customer experience, analyze customer behavior, forecast sales, and enhance marketing efforts. Whatever profession they go into, Davis wants Fort Smith students to leave school ready.
That’s why Davis makes data exploration a regular part of her teaching. Using tools like Tuva, she helps students see data not as an abstract concept but as a way to make sense of the world around them.
Helping Students See Data is Everywhere
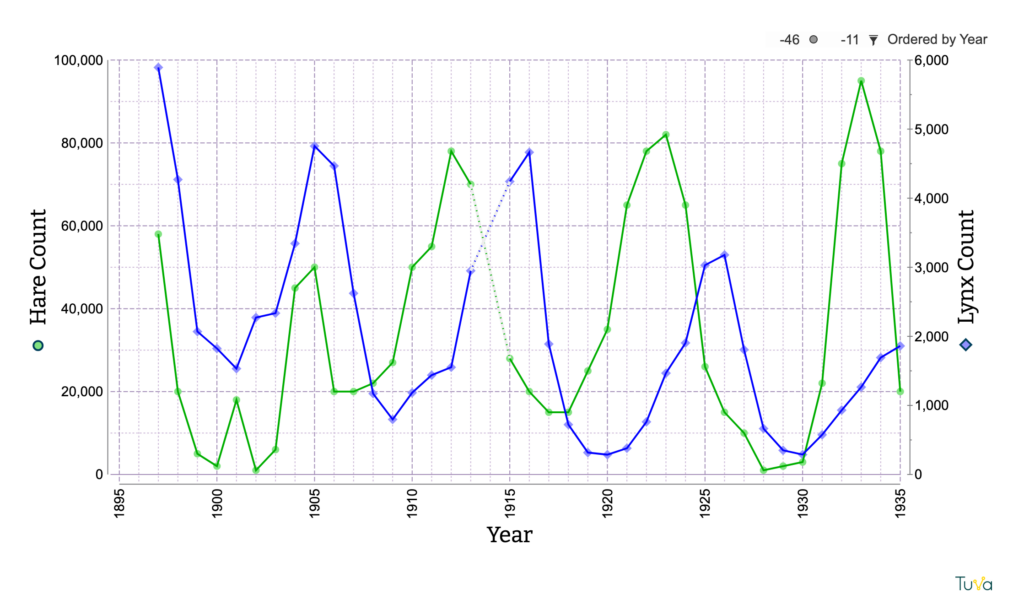
To help students see data as a way of understanding the world, Davis emphasizes that patterns in nature are often mirrored by human experience. For example, students notice a cyclical pattern when studying population dynamics. The prey population grows, leading to an increase in predators, followed by a decline in prey due to predation, which then causes predator numbers to drop as well. Then the cycle starts anew. Afterwards, Davis discusses patterns in our everyday lives that follow a remarkably similar pattern, such as supply and demand or the fashion cycle.
“Let’s not do the eighties again,” Davis jested. “But we know it’s gonna come back. It always does.”
Davis helps students see parallels between natural patterns, like those in this Lynx and Snowshoe Hare dataset, and patterns in human behavior–such as supply and demand or fashion cycles.
Davis thinks teachers in other disciplines could use data to help students understand their content and, simultaneously, improve their data literacy. For example, an English teacher reading “The Giver” with students could have them graph Jonas’ opinion of his father throughout the story. The visual representation would help students notice where the story turns. A social studies teacher could use census data to enrich their lessons too. Students could compare 1940 and 1950 census data to examine how World War II reshaped the U.S. workforce.
Everything, Davis tells her students, is data–whether it’s a predator-prey relationship, a plot twist, or a fashion trend. Everything follows a pattern. Everything has a next. Davis uses Tuva regularly in her instruction because it reveals these cause-effect relationships to students.
“Tuva shows them how one change makes a huge difference,” she explained, adding that students can apply that to weigh decisions in their own lives. “Practice on Tuva helps them reason through problems better. And I just think that it is imperative.”
Fitting in Regular Practice
Davis incorporates data into her daily routine, assigning a “graph of the week” as bell work. The graph is typically tied to the core idea of the current unit.
“It’s just like practicing your instrument. If you only play it a couple of times, you’re not gonna be great.”
Davis’ bell work follows a similar trajectory each week. On Monday, students identify the scale, title, axes labels, independent variable, and dependent variable. Difficulty identifying basic graph components is common among secondary students, but Davis observes that this challenge decreases with frequent practice.
“It’s just like practicing your instrument. If you only play it a couple of times, you’re not gonna be great,” explained Davis. “It’s a repeated practice that students need to be data literate.”
On Tuesday and Wednesday, Davis’ students analyze the graph, noting patterns and trends. By Thursday, they begin using the graph to make predictions.
By assigning the weekly graph as bell work, Davis minimizes instructional time spent while keeping students’ data skills sharp.
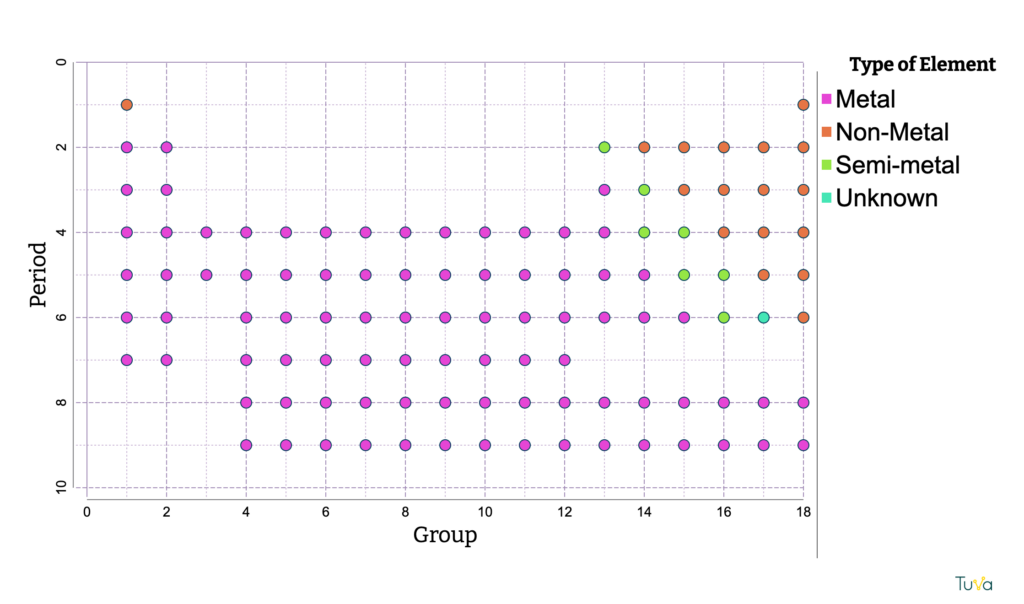
Davis’ favorite graph to use with students shows the elements with Group on the x-axis and Period on the y-axis. “It’s funny,” Davis said. “They just think it’s a list. And then when you graph it, they’re like, ‘Oh, there’s a reason!’ They don’t believe me till they see the data.”
Preparing for a Data-Driven Future
For Davis, data literacy isn’t just for scientists or mathematicians—it’s a universal skill that’s essential in today’s hyper competitive job market.
“We are now on a global stage. We are competing against people we will never meet,” she explained. “Students will need to be able to gather information, analyze it, synthesize it, and make decisions about it quickly.”
That’s why Davis weaves data into her daily instruction. An early adopter of Tuva, she has used the platform since 2017 to help her students build data skills—completing more than 3,500 assignments in the process.
She hopes more teachers will embrace data literacy and sees Tuva as a tool that makes integrating data into instruction doable for busy teachers.
“Tuva is a gem. It should be shining on everyone’s desktop.”
“Tuva is a gem,” Davis said. “It should be shining on everyone’s desktop.”
Real-world pedagogy and data literacy are at the heart of Tuva’s mission. Today, we are advancing that work further by enabling you to create custom activities in Tuva using your own data.
The Tuva Activity Builder allows you to place your best lesson ideas beside our powerful, accessible data visualization tools. That means the ability to quickly explore data and create, revise, and analyze graphs will be right at your students’ fingertips.
Five Reasons to Take Advantage of Tuva’s New Activity Builder
1. Strengthen Connection, Deepen Comprehension
Collect data with your students one day, then incorporate their dataset into a lesson on Tuva for the following day. Students will have a deeper connection to and comprehension of the data when they’ve collected it personally.
This deep involvement in the entire science process–from collection to sophisticated visualization and analysis–helps students see themselves as scientists, not just people learning about science.
2. You Pick the Phenomena, We Provide the Tools
Your creativity far exceeds the bounds of our Science Content Library; we simply cannot encompass every possible anchoring phenomenon. The ability to craft lessons in Tuva from your own datasets allows you to stick closely to your anchor phenomenon without sacrificing the benefits afforded by the Tuva tools.
3.Create Lessons That Speak to Your Students
Relevance drives student engagement. Use local data to center your math or science lessons around places familiar to your students. Alternatively, capitalize on your students’ unique personalities by pulling in data about topics you know interest them.
4.Make Graphing Accessible to All Learners
Our tools are designed to be accessible for learners with diverse abilities. So, when you create your lesson in Tuva you can rest assured all students will be able to engage meaningfully with data. (Learn more about Tuva’s Commitment to Accessibility.)
5.Strut Your Stuff and Help Make the Future #DataLit
You’re brilliant. Your work should be shared. You can now enable school colleagues and far-flung teacher friends to use more data in their instructional practice by sharing a direct link to your original lessons in Tuva. (And while you’re at it, remind them to hit you back. It’s a team effort.)
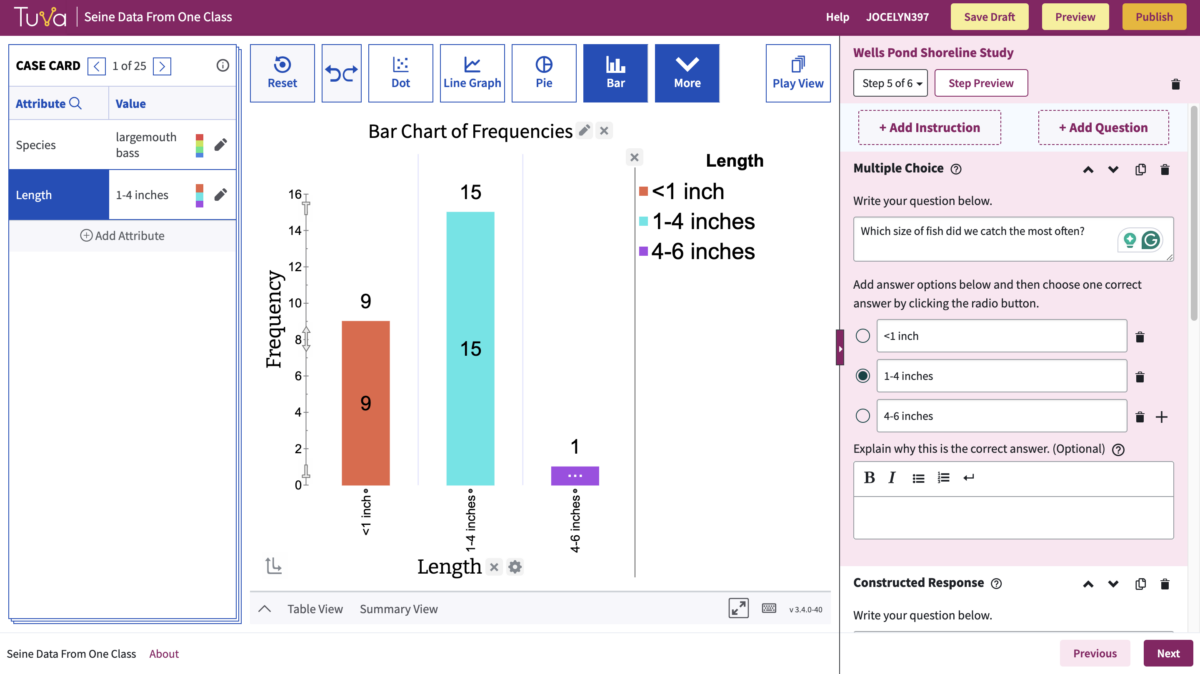
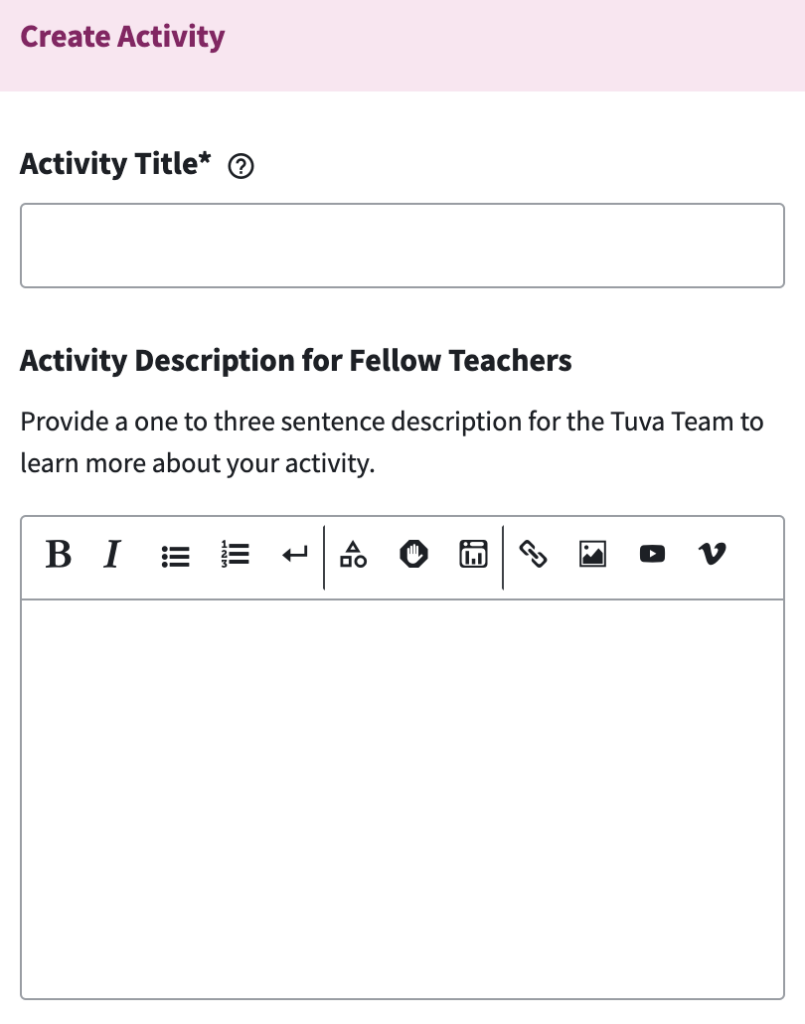
How to Get Started Building Lessons
Select My Datasets on the Dataset Library dropdown.
Insert or upload data.
Select the Create Activity button in the lower right corner.
Create your activity.
Select Publish.
Choose one of the options: Publish Privately or Request Public Sharing.
Now, start sharing!
Sign Up for a (FREE) Private Tutorial
We’d be glad to show you how to use the Activity Builder. Sign up for a 30-minute office hours session to meet virtually with one of our educational specialists for a one-on-one tutorial.