Coming Soon – Automatic Grading on Tuva!

During the initial design phase of Tuva Activities and Lessons, one critical decision we made was that activities on Tuva would only initially support one item type – open-ended questions.

Why? We felt that activities and lessons based on authentic datasets gave both educators and learners a unique opportunity to look beyond the straightforward multiple-choice and True/False questions. 

With actual data and tools at our fingertips,  educators can pose a number of interesting, open-ended questions that gave learners an opportunity to:

  1. Practice and gain exposure to the language of data, statistics, and graphing.
  2. Construct arguments and support their reasoning with evidence from the data and their own visuals.
  3. Explain their thinking in words, giving them an opportunity to focus on their grammar, sentence construction, as well as learn the techniques of quantitative reasoning.
  4. Describe in words the various aspects of the data, including:
    1. Any patterns or interesting phenomenon they discover.
    2. Distribution of various attributes, such as its shape, its spread, or its center

                                        Image: New Item Type on Tuva

Over the last twelve months, we have received a variety of feedback from educators across math, science, statistics, and many other subject areas about being able to ask (and immediately grade) straightforward, multiple-choice questions at the beginning of the activity to assess for basic understanding, and then gradually build towards the more difficult, open-ended questions.

I am excited to announce that we will soon be adding these two new features – Multiple Choice Questions and Automatic Grading – to Tuva Activities and Lessons.

For Tuva Basic teachers, you will be able preview these new features via a number of different activities on the 25 Free Tuva Datasets.

For Tuva Premium subscribers, you will see this feature gradually introduced across all of our 400+ activities and lessons around 315+ datasets, as well as many of the new activities and lessons we release moving forward.  

Introducing An Easier Way to Filter & Find Datasets on Tuva!

There are 300+ Tuva Datasets in our library covering topics such as the Climate Change, Land & Sea Animals, Presidents of the United States, and many many more.

Today, we are excited to do an initial launch of a more powerful Filter Bar to meet the diverse needs of our educators within the Tuva community.

A More Powerful Filter Bar:

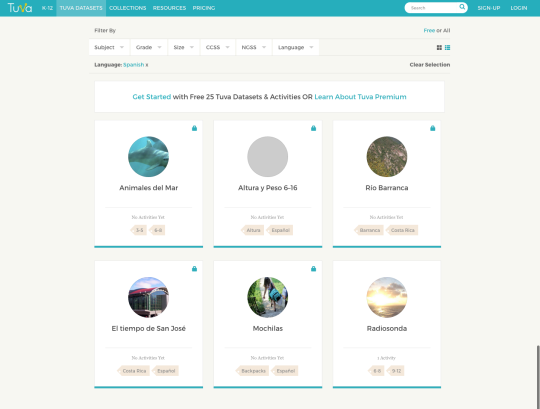
Now, if you wanted to find all the Science or Environment-related Tuva Datasets that are small in size, you can find them very quickly by choosing Science & Environment in the Subject drop-down and 1-40 in the Size drop-down, like this:

As you can see above, you can now filter and find Tuva Datasets based on a number of additional parameters beyond Subject & Grade Level such as:

  1. The Size of the dataset (How many data points are there?)
  2. The NGSS standard (particularly relevant for all our US Science Educators)
  3. The dataset Language (For our non-English speaking educators and learners)

Now, if you wanted to find all the Science or Environment-related Tuva Datasets that are small in size, you can find them very quickly by choosing Science & Environment in the Subject drop-down and 1-40 in the Size drop-down, like this:

Or, if you wanted to find a dataset that is related to the MS-ESS3-5 (Earth & Human Activity) NGSS Standard, you can find it very quickly by choosing MS-ESS3-5 in the NGSS drop-down, like this:


Send Us Your Favorite Datasets & Win

Do you have a favorite dataset that you have used in your previous lessons or units? Does it come from an authentic source? Is it licensed under Creative Commons? Are you able to link to it?

Send us your favorite datasets to hello@tuvalabs.com over the next two weeks and enter a chance to win a Tuva T-shirt, a Tuva Coffee Mug, and other goodies!

What does NGSS look like in the classroom?

By Stephen Farnum – Middle School Science Teacher, Greenwich Public Schools & Tuva K-12 STEM Content Specialist

When I speak with fellow educators about Next Generation Science Standards, they usually tell me they understand “what” NGSS is, but have concerns about “how?”

How can I help my students meet these expectations? How does my instruction need to change? How am I going to find resources to help?

Tuva is on a quest to help science educators implement NGSS in their classrooms through our growing library of authentic datasets, interactive graphing tools, and ready-to-use activities and lessons. 

One aspect of this is to make it easier for teachers to create their own high-quality, NGSS-aligned lessons. 

In support of this, I recently collaborated with them to create Characteristics of an Effective Data-Driven Science Lesson, a checklist for teachers to use while creating or improving data-driven lessons which combine science, math, and problem-solving. 

I combined input from the NGSS Science and Engineering Practices as well as what I’ve learned from my students as they have developed their understanding of science and math through data analysis.

Once we completed the checklist, we realized that many teachers would like to see these characteristics of a data-driven science lesson in action.

Exemplar Science Lesson on Tuva

I created a lesson titled “How to Mitigate Hurricane Damage” to show one way of applying these characteristics to create an NGSS-aligned learning activity on Tuva.

I began with NGSS Middle School DCI: 

“Analyze and interpret data on natural hazards to forecast future catastrophic events and inform the development of technologies to mitigate their effects” (MS-ESS3-2). 

I searched the Tuva Datasets library to find a dataset titled – Hurricane Sandy, Her Brother and Sisters – that was relevant to the DCI. The source of the dataset is NOAA’s National Climate Data Center, and it has 654 Data Points (or cases) and 7 Attributes. 

I used Tuva’s graphing tools to explore relationships between different attributes. Noticing correlations between hurricane latitude, frequency, and severity, I designed a task that would guide students to investigate these relationships: 

“Create an evidence-based proposal for where a new hurricane mitigation structure should be placed” 

You can checkout the finished activity here, and feel free to use it in your classroom during your next Earth Science activity! 

image

Tuva NGSS Resources

The ability to easily find and create open-ended and student-centered learning activities shows Tuva’s potential as a tool for aligning K-12 STEM curricula with NGSS. 

If NGSS leaves you wondering “how?”, Tuva’s NGSS resources are a great place to start.

Introducing Tuva Collections

At Tuva, our goal is to make data accessible and usable for data novices and learners, enabling them to learn and master foundational data, statistics, and analytical concepts and skills.

The Open Data Movement has catalyzed something incredibly powerful – free, open access to millions of datasets from a vast number of organizations such as the World Bank, NIH, NASA, CDC, NOAA, FDA, Census Bureau, Department of Education, Department of Energy, and many many others. 

We believe that these open datasets can serve a powerfully unique purpose. These datasets can be transformed into opportunities for deep inquiry, exploration, and learning. They enable educators to teach and students to learn critical data exploration, visualization, analysis, and interpretation, as they dig deeper into topics aligned to their curricula and standards, their interests, or their day-to-day work.  

To continue to realize on our vision, we are excited to formally announce the launch of Tuva Collections! 

What is a Tuva Collection?

A collection is a group of ready-to-use datasets, activities, and lessons around a specific content area (such as Linear Models) or topic (such as Social Justice). 

How many collections are on Tuva?

Currently, we have 4 Tuva Collections (and plenty more in the works!). They are:

1. Signs of Change – Discovering events and phenomena in US History using US Census Microdata

2. The Model Shop –  Using data to learn about Linear Models

3. Civic Literacy Through Data – Explore social issues including gender equality, gender identity, immigration, and racial justice in the United States through the lens of data

4. Employment in NYC – Exploring Employment in NYC through the lens of the 5 Boroughs, Race, Educational Attainment, Gender, and many other factors

Are you open to collaborations to create a new Tuva Collection?

Yes – we have many more Tuva Collections in the works so please stay tuned! 

We are already working with organizations such as Democracy Prep Public Schools and NYC Department of Education to design and produce our Tuva Collections. 

If you are interested in collaborating with us to create a Tuva Collection, please reach out to us at hello@tuvalabs.com

Introducing the Model Shop – Enabling Students to Learn Modeling

From the CCSS Standards of Mathematical Practice – Modeling with Mathematics practice:

“Mathematically proficient students can apply the mathematics they know to solve problems arising in everyday life, society, and the workplace. In early grades, this might be as simple as writing an addition equation to describe a situation. In middle grades, a student might apply proportional reasoning to plan a school event or analyze a problem in the community. By high school, a student might use geometry to solve a design problem or use a function to describe how one quantity of interest depends on another.” 

From the High School Common Core Standards on Modeling:

“Modeling links classroom mathematics and statistics to everyday life, work, and decision-making. Modeling is the process of choosing and using appropriate mathematics and statistics to analyze empirical situations, to understand them better, and to improve decisions.”

From Science and Engineering Practice in the NGSSDeveloping and Using Models practice: 

“Models include diagrams, physical replicas, mathematical representations, analogies, and computer
simulations. Although models do not correspond exactly to the real world, they bring certain features into
focus while obscuring others. All models contain approximations and assumptions that limit the range of
validity and predictive power, so it is important for students to recognize their limitations.” 

Building on our Signs of Change content initiative that brings history and mathematics together for students, we are excited to announce the Model Shop, our next math and science content initiative dedicated to an incredibly important concept – Modeling.

The Model Shop contains Tuva datasets and activities that enable your students to build a strong foundation about Modeling. Students get an opportunity to use elementary, linear functions to make mathematical models of real data. 

Through our activities and lessons, students will get an opportunity to answer the following questions – What is a mathematical model? How is a mathematical model developed? How does the mathematical model represent our reality, and what is the meaning behind the curve and the parameters? 

We are starting the Model Shop initiative with linear models, giving students an opportunity to create a model for data related to a pencil sharpener, book pages and thickness, Chinese trains, Hooke’s law, and others. Over time, we will continue to add datasets and activities beyond just linear models, including logarithmic, quadratic, exponential, and others. 

All the Tuva Datasets and Activities in the Model Shop are fully accessible only to Tuva Premium customers. Learn more about Tuva Premium here or get in touch with us directly.