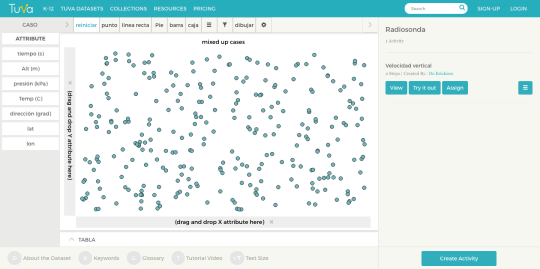
Explorar datos en Tuva

Tuva’s dynamic, easy-to-use data exploration and visualization tools are now available in Spanish.

Today, we are excited to take our first few steps in bringing Tuva’s Data Literacy Solutions to schools, higher education institutions, businesses, and sustainable development organizations globally. 

Our dynamic, easy-to-use data exploration and visualization tools are now available in Spanish, enabling Spanish-speaking learners around the world build a strong foundation in data and statistical literacy.

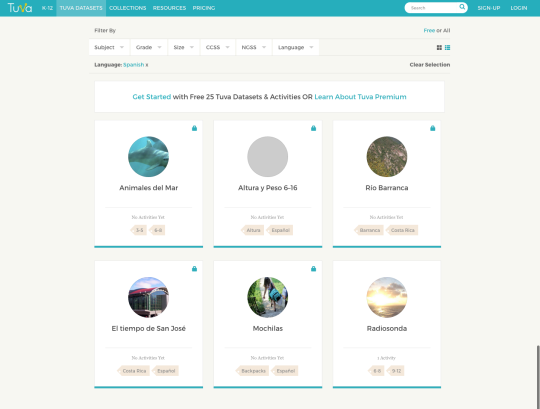
You can find our Spanish language datasets on our Tuva Datasets Library.  

Once you choose your Spanish-language dataset, you will find that all the dataset attributes, as well as all the features and functions on the toolbar are labeled in Spanish. 

Over the next couple of weeks, we will make Tuva’s data exploration and visualization tools available in other languages, so please stay tuned for further updates and announcements. 

For now, vamos a aprender datos sobre Tuva!

More Updates to the Filter Bar

We have made additional updates to the Filter Bar on Tuva Datasets, following up from our announcement a few weeks ago regarding a more powerful Filter Bar. 

Now, you can filter for Tuva Datasets and activities by a specific Common Core Math Standard, Domain, or Topic.

The CCSS-related Filter categories include: Comparing Groups, Correlation, Comparing Data, Linear Equations, Modeling, Quantitative Relationships, and many topics and standards.

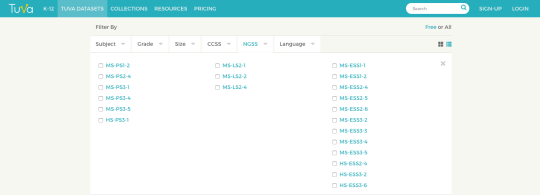
In addition, we are continuing to extend our coverage of the Next Generation Science Standards, and have curated a number of fantastic new datasets covering additional NGSS Physical Science, Life Science, and Earth & Space Science standards. To learn more, explore all the datasets in our Tuva Datasets Library

Remember, you can always reach out to us if you are unable to find a dataset for your needs. 

Coming Soon – Automatic Grading on Tuva!

During the initial design phase of Tuva Activities and Lessons, one critical decision we made was that activities on Tuva would only initially support one item type – open-ended questions.

Why? We felt that activities and lessons based on authentic datasets gave both educators and learners a unique opportunity to look beyond the straightforward multiple-choice and True/False questions. 

With actual data and tools at our fingertips,  educators can pose a number of interesting, open-ended questions that gave learners an opportunity to:

  1. Practice and gain exposure to the language of data, statistics, and graphing.
  2. Construct arguments and support their reasoning with evidence from the data and their own visuals.
  3. Explain their thinking in words, giving them an opportunity to focus on their grammar, sentence construction, as well as learn the techniques of quantitative reasoning.
  4. Describe in words the various aspects of the data, including:
    1. Any patterns or interesting phenomenon they discover.
    2. Distribution of various attributes, such as its shape, its spread, or its center

                                        Image: New Item Type on Tuva

Over the last twelve months, we have received a variety of feedback from educators across math, science, statistics, and many other subject areas about being able to ask (and immediately grade) straightforward, multiple-choice questions at the beginning of the activity to assess for basic understanding, and then gradually build towards the more difficult, open-ended questions.

I am excited to announce that we will soon be adding these two new features – Multiple Choice Questions and Automatic Grading – to Tuva Activities and Lessons.

For Tuva Basic teachers, you will be able preview these new features via a number of different activities on the 25 Free Tuva Datasets.

For Tuva Premium subscribers, you will see this feature gradually introduced across all of our 400+ activities and lessons around 315+ datasets, as well as many of the new activities and lessons we release moving forward.  

Introducing An Easier Way to Filter & Find Datasets on Tuva!

There are 300+ Tuva Datasets in our library covering topics such as the Climate Change, Land & Sea Animals, Presidents of the United States, and many many more.

Today, we are excited to do an initial launch of a more powerful Filter Bar to meet the diverse needs of our educators within the Tuva community.

A More Powerful Filter Bar:

Now, if you wanted to find all the Science or Environment-related Tuva Datasets that are small in size, you can find them very quickly by choosing Science & Environment in the Subject drop-down and 1-40 in the Size drop-down, like this:

As you can see above, you can now filter and find Tuva Datasets based on a number of additional parameters beyond Subject & Grade Level such as:

  1. The Size of the dataset (How many data points are there?)
  2. The NGSS standard (particularly relevant for all our US Science Educators)
  3. The dataset Language (For our non-English speaking educators and learners)

Now, if you wanted to find all the Science or Environment-related Tuva Datasets that are small in size, you can find them very quickly by choosing Science & Environment in the Subject drop-down and 1-40 in the Size drop-down, like this:

Or, if you wanted to find a dataset that is related to the MS-ESS3-5 (Earth & Human Activity) NGSS Standard, you can find it very quickly by choosing MS-ESS3-5 in the NGSS drop-down, like this:


Send Us Your Favorite Datasets & Win

Do you have a favorite dataset that you have used in your previous lessons or units? Does it come from an authentic source? Is it licensed under Creative Commons? Are you able to link to it?

Send us your favorite datasets to hello@tuvalabs.com over the next two weeks and enter a chance to win a Tuva T-shirt, a Tuva Coffee Mug, and other goodies!

New Feature: Plotting Multiple Numerical Attributes on the Same Axis

When it comes to exploring data, how one organizes the dataset is incredibly important. Typically, each column should represent an attribute and each row should represent one observation. There are certain best practices one should follow when organizing a dataset, but we will leave that for another post.

There are times when the data is organized a bit differently, one needs to be able to plot multiple attributes on the same axis in order to meaningfully explore and analyze the data. Today, we are launching this functionality on Tuva.

Once you drag and drop an attribute on the x- or y-axis, you will be able to drag another attribute and drop it on the small rectangular box that appears below the attribute on that same axis. Here is a brief video showcasing this new feature in an example:

What do you think about this feature? Take it for a spin on the Climate Change or World Populations dataset, and post your comments, ideas, or feedback in the discussion thread.