Middle School Science Team Upends Expectations
Knowing how to create graphs by hand is an essential skill.
That may have been unexpected, coming as it does from the blog of a digital graphing tool. However, it’s important to clarify that using a graphing tool, like Tuva, and manually graphing are not at odds with each other; nor does one necessarily serve as a prerequisite. In fact, as the middle school science team at Northwest Middle School discovered, the two approaches are synergistic.

“[Our students’] ability to see the numerical data in a graphical form is really transitioning from one realm to the other,” explained teacher Judith Neugebauer.
The team, which also includes teachers Victoria Mauro, Anne Salisbury, and John Pikus, is based out of a school in Salt Lake City. They began augmenting their manual graphing practices with Tuva’s digital graphing tools about a year ago.
The Most Persistent Problems for Novice Graph Creators
Adding digital graphing tools to the mix for novice graph makers is a step some are reticent to take. (Psst… I used to be amongst them.) Because digital graphing tools automatically do some of the steps for students, teachers wonder if students should know how to graph manually before they begin utilizing digital tools.
Before we address that concern, let’s take a step back to consider the most common skills with which novice graph makers struggle:
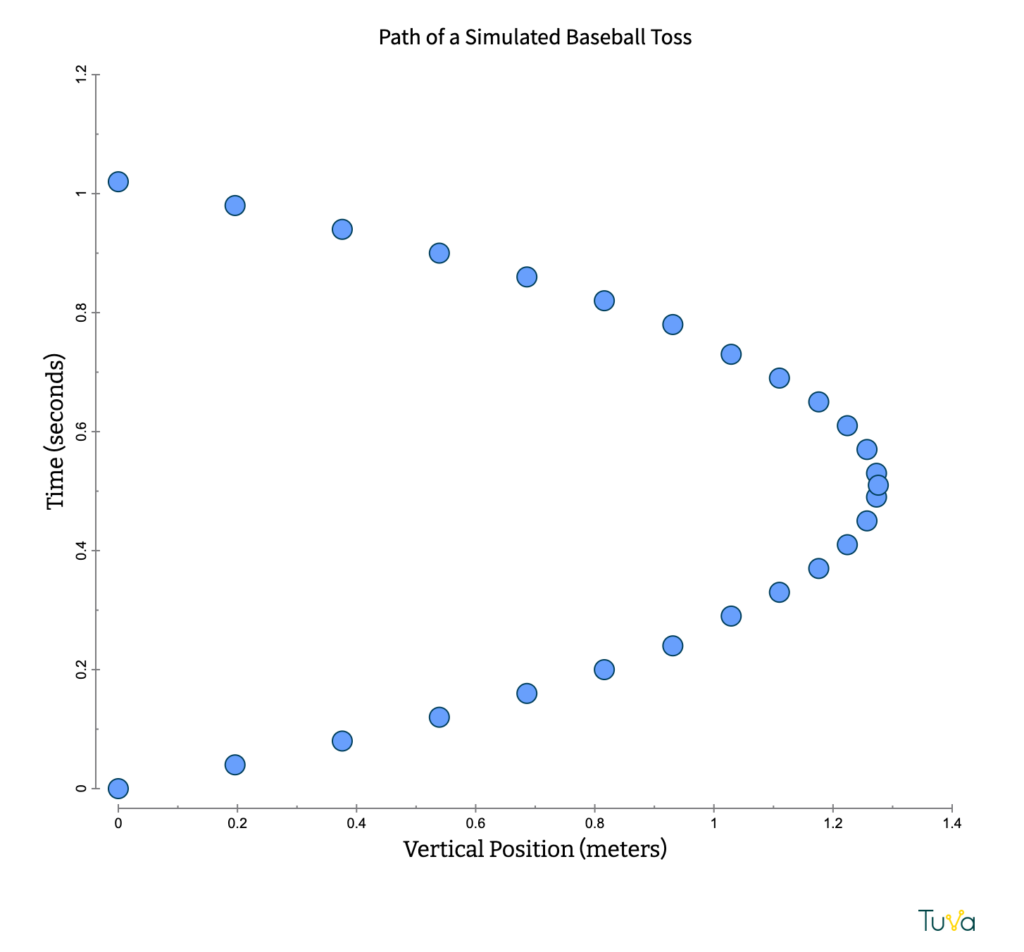
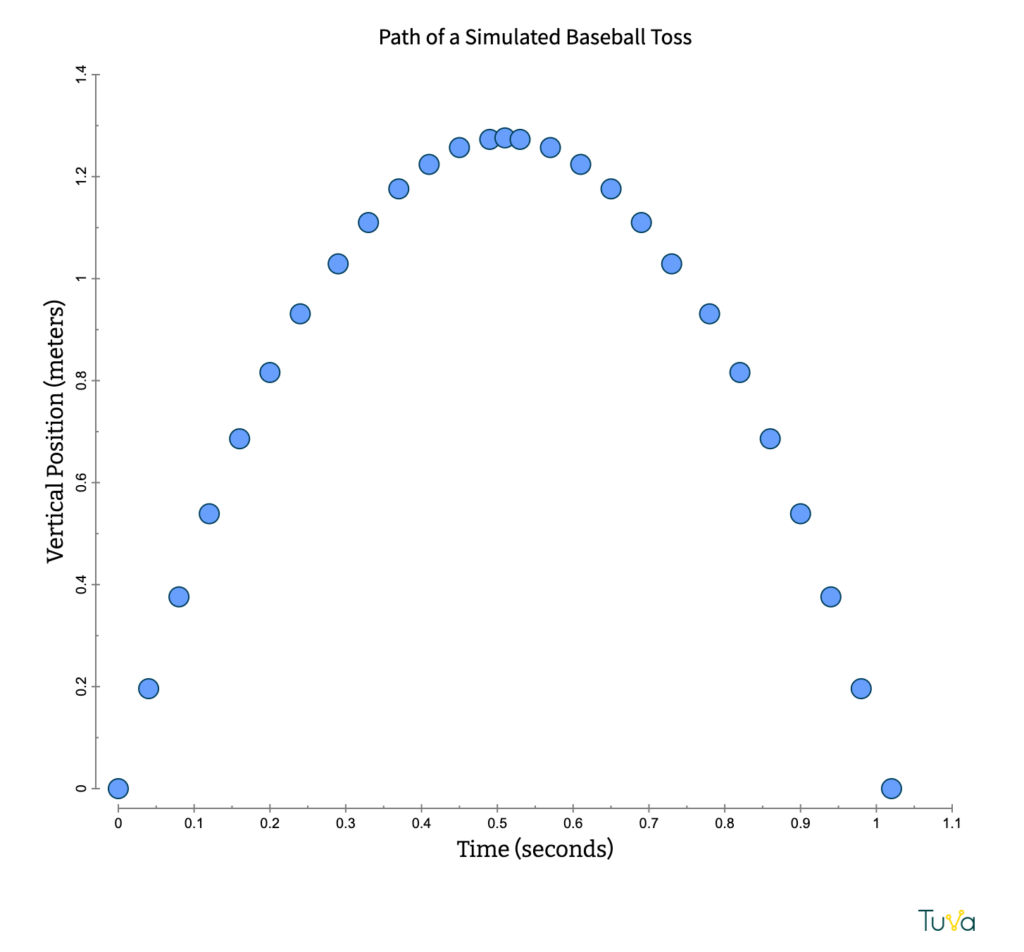
- Placing variables on the correct axes
- Setting up equal intervals and scaling them appropriately
- Choosing an appropriate graph type
- Accurately plotting data points
- Including descriptive titles
The question is, then, will using digital graphing tools before students have mastered manual graphing prevent students from developing these important skills?
Better Together
Data literacy education expert, Molly Schauffler said that 15 years ago she would have said yes, but the development of drag-and-drop graphing tools, like Tuva, shifted her perspective.
“My sense now is that playing with the data and visualizing it on a digital platform gives students a visual sense of purpose, direction, possibility, and choice without getting mired in drawing and mechanics,”Schauffler said. “That said, I am still an advocate of hand drawing graphs alongside digital exploration.”
Schauffler is a founding member of a group called Partners in Data Literacy, a paleoecologist, an assistant research professor emerita for the University of Maine, and a former Tuva consultant.
“We still have them graph in their notebooks too, but this year it’s going way faster.”
The benefits of using both methods simultaneously are evident at Northwest, where teachers say making graphs on Tuva has hastened the development of manual graphing skills for their 7th- and 8th-grade students.
“We still have them graph in their notebooks too,” Neugebauer explained, “but this year it’s going way faster.”
The teachers there credit the uptick in pace to repeated exposure to and practice with variable placement and graph types in Tuva.
Our Suggestions for Achieving Synergy
Digital graphing tools exist on a spectrum from fully automated to completely open and incremental. When combining manual and digital graphing practices, consider how the features of the digital tool may impact skill development.
For Tuva users helping graphing novices master the five skills listed above, we suggest pairing manual graphing and Tuva in the following way:
| Practice Manually | Practice With Tuva |
|---|---|
| Setting up equal intervals and scaling them appropriately | Placing variables on the correct axes |
| Accurately plotting points | Choosing an appropriate graph type |
| Adding descriptive titles |
In most instances, Tuva sets up intervals and plots data automatically once students have chosen which attributes (variables) to drag to which axes. Doing these things manually helps students understand a block on the graph represents a specific numerical increase.
That said, it is not necessary for students to practice establishing equal intervals and plotting data points every time they graph. In fact, sometimes it gets in the way of the other skills students are trying to master. Making graphs manually is so time-consuming that it is hard to achieve rapid repetition of a skill. Repetition is incredibly helpful for achieving mastery when it comes to placing variables, choosing graph types, and writing titles. Tuva enables targeted practice in these aspects of graphing. Students can also quickly and easily fix errors instead of needing to start all over, avoiding frustration and shutdown.


Are We Graphing for Graphing’s Sake?
Perhaps, however, this entire discussion misses the point. Why is it important for our students to be able to create graphs? Is it simply so that they can create graphs? Of course not. The ultimate goal is to empower students to uncover insights about data through their graphs. Scientific literacy and data literacy are, after all, inextricable.
It’s easy to lose sight of that goal, however, in the day-to-day slog of asking kids over and over and over, “If you count up by ones, will you have enough space on your graph paper?” or, “Where does the independent variable go again?” And if we’ve lost sight of our goal, chances are our students never even knew a larger purpose existed in the first place. Of course, student motivation suffers when there is a lack of purpose.
Northwest teacher Anne Salisbury said Tuva has helped boost student engagement in the graphing process.
“I think using Tuva has convinced them that graphing has a purpose,” she said. “The point is not just to make a graph; it’s to use a graph. In the past we spent so much time getting them to physically graph on paper, that we did not have time to analyze data that is already graphed and figure out what it means.”