
In 2023, Minnesota saw an unprecedented 22 air quality alerts in just 52 days. And for one day in mid-May 2024, St. Paul held the unenviable position of worst air quality in the United States.
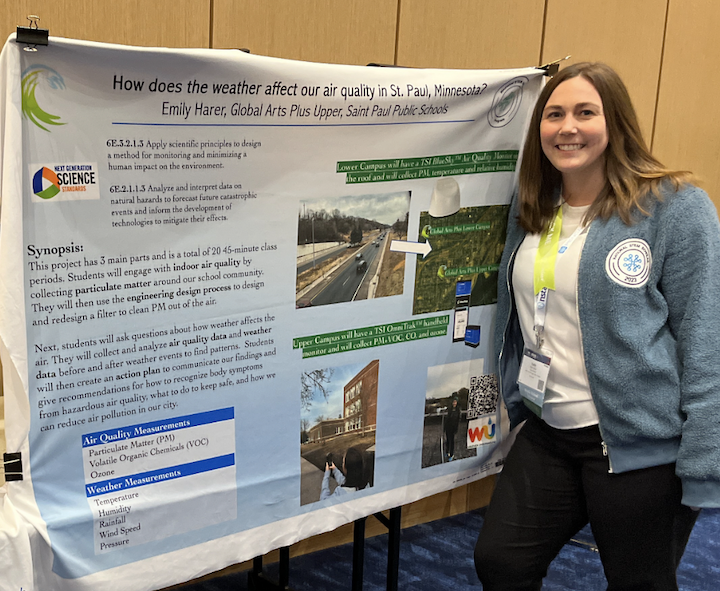
6th-grade Earth Science Teacher Emily Harer saw potential for authentic science learning in the unfortunate air quality downturn. Air quality issues are a suitably complex issue. Since the publication of the Next Generation Science Standards in 2013, major emphasis has been placed on anchoring science learning in complex phenomena. Even better, it was a phenomenon her students could immediately relate to.
“National curriculum is often focused on things that aren’t local,” she explained. “Having local phenomena is extremely important for students to latch onto.”
Harer, who teaches at Global Arts Plus Upper School in St. Paul, said she wants students to know that science is all around them and that they can contribute to the body of science knowledge through research and data collection. That’s much easier to do if the phenomenon they’re studying is local and relevant.
Putting Local Data into Students’ Hands
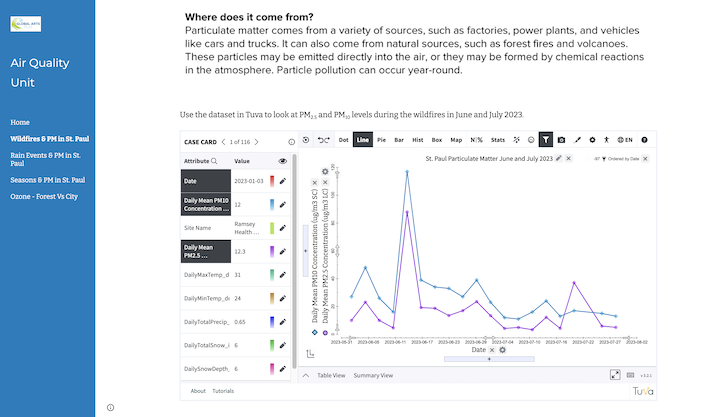
During the 2023-24 school year, Harer engaged her students in a month-long air quality unit. Throughout the unit, Harer had her students investigate the myriad factors contributing to air quality. Using historical weather and air pollution data from the National Weather Service and the Environmental Protection Agency, Harer created datasets using all local data. Then she uploaded them into Tuva and embedded them into the lessons on her class website.
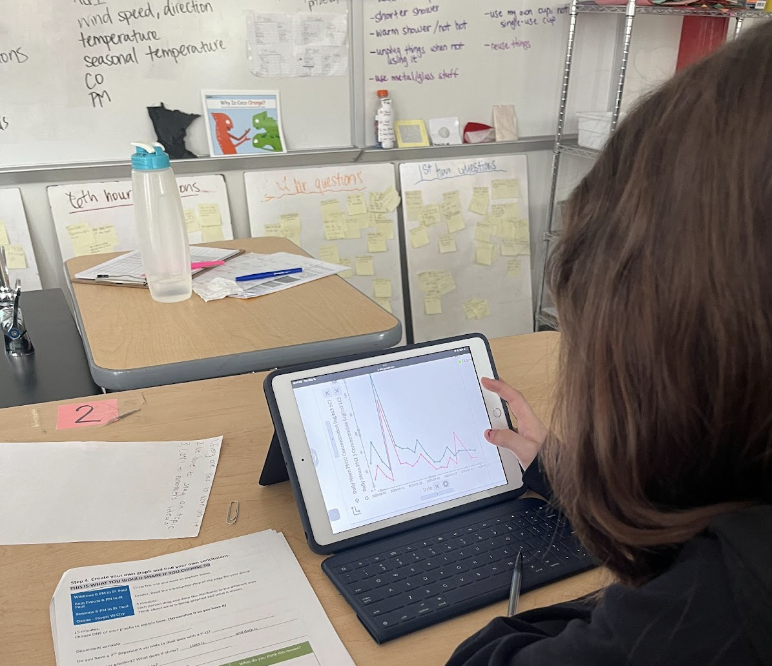
“It was exciting to see students think about experimental setup, drag and drop the attributes, to then find answers to their questions,” said Harer.
Hosting the data in Tuva allowed her students to more easily interact with it and to look for relationships between particulate matter and other variables such as wildfires, rainfall, seasons, and land cover.
Students were able to manipulate the data to determine when wildfire smoke was in the air in Ramsey County in 2023. They saw the daily changes in particulate matter through time and could point directly to when the wildfire happened.
The complexity of the phenomenon prompted students to generate new questions as they encountered unexpected findings. For example, when they compared ozone and temperature data in Ramsey County to Voyageurs National Park to the north, they realized that their prediction was actually opposite to what the data showed. Voyageurs National Park had substantially more ozone than Ramsey County in the spring. This cognitive dissonance spurred further inquiry and research.
Outcomes: Engagement and Deep Understanding
The combination of real-world, local data and Tuva tools is one Harer plans to repeat for two reasons: engagement and depth of understanding.
“I don’t usually see people getting that jacked about graphs,” admitted Harer.
Memorable student reactions when playing with the data on Tuva included: “Oh wow! Oh my gosh, I just did that!”, “Whoa! The rain washed that particulate matter out!!” and, “Dang! This is really life… in St. Paul.”
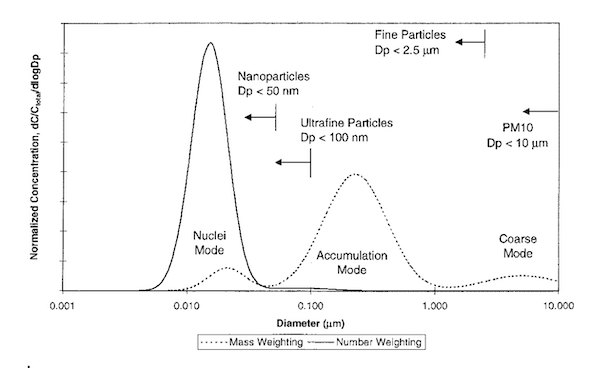
Engagement drove learning. By the end of the unit, students really understood particles in the air and were asking deep questions about weather, topography, vegetation, and air quality – startling high-quality questions. Jason Johnson, chief engineer at TSI Inc., a Minnesota-based company that designs and engineers air monitors for scientific research, visited the class near the end of the unit. During his visit, he projected a graph from his graduate program and was surprised at the students’ insightful observations and questions.
“They are 6th-graders, and they understand this so deeply!” he told Harer.
Taking it Even Further
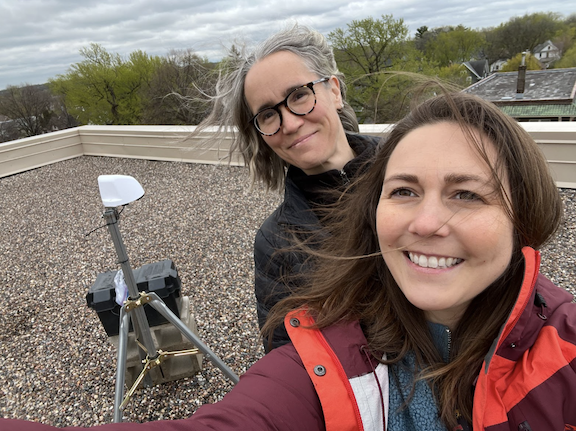
This year, Harer plans to expand the project to include data collected by instruments on the roof of the school buildings. The campus has a weather station. Last year, Harer was able to use grant funding from the National STEM Scholar Program to purchase and install a BlueSky air quality monitor as well. By the time her Air Quality Unit rolls around, she will have a full year of data from these instruments. She anticipates that her hyper-local weather and air quality data will be even more engaging for her students and will help them understand how science fits into their lives.
“I see science everywhere. When kids do too, that is so exciting” she said. “I want kids to see how cool Minnesota is and that we have a lot to offer here.”
Incorporate Local Data into Your Lessons
Uploading data into Tuva and sharing it with your students is simple. Here are the steps and, in case you need help, links to our associated support pages.
- Find data and, if it is not already, put it into a spreadsheet.
- Upload the data on Tuva.
- Share the dataset by assigning it to your class or embedding it onto your website.