During the initial design phase of Tuva Activities and Lessons, one critical decision we made was that activities on Tuva would only initially support one item type – open-ended questions.
Why? We felt that activities and lessons based on authentic datasets gave both educators and learners a unique opportunity to look beyond the straightforward multiple-choice and True/False questions.
With actual data and tools at our fingertips, educators can pose a number of interesting, open-ended questions that gave learners an opportunity to:
- Practice and gain exposure to the language of data, statistics, and graphing.
- Construct arguments and support their reasoning with evidence from the data and their own visuals.
- Explain their thinking in words, giving them an opportunity to focus on their grammar, sentence construction, as well as learn the techniques of quantitative reasoning.
- Describe in words the various aspects of the data, including:
- Any patterns or interesting phenomenon they discover.
- Distribution of various attributes, such as its shape, its spread, or its center
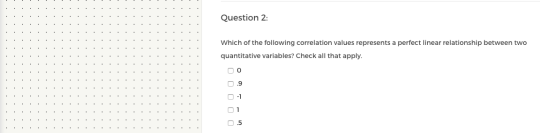
Image: New Item Type on Tuva
Over the last twelve months, we have received a variety of feedback from educators across math, science, statistics, and many other subject areas about being able to ask (and immediately grade) straightforward, multiple-choice questions at the beginning of the activity to assess for basic understanding, and then gradually build towards the more difficult, open-ended questions.
I am excited to announce that we will soon be adding these two new features – Multiple Choice Questions and Automatic Grading – to Tuva Activities and Lessons.
For Tuva Basic teachers, you will be able preview these new features via a number of different activities on the 25 Free Tuva Datasets.
For Tuva Premium subscribers, you will see this feature gradually introduced across all of our 400+ activities and lessons around 315+ datasets, as well as many of the new activities and lessons we release moving forward.