“You cannot help but learn more as you take the world into your hands. Take it up reverently, for it is an old piece of clay, with millions of thumbprints on it." – John Updike
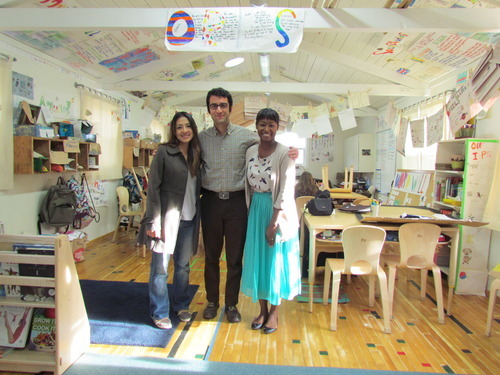
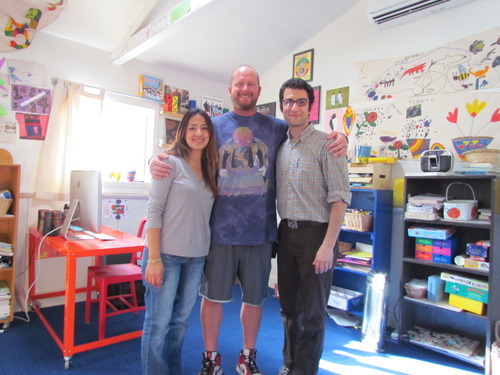
Today, we are launching an brand new initiative to share with you short stories of students across the country learning math and statistics through relevant, meaningful, real-world topics on Tuva while building their data literacy, problem-solving, and critical thinking skills. We hope these stories inspire you to conduct similar activities with your students and empower them with the confidence and skills to tackle tomorrow’s challenges.
How much energy do we
really
consume? Has the amount of energy we consume been increasing or decreasing over the last few decades? Fourth grade students in McKinney, Texas decided to dig into the real, residential energy consumption data and tackle these questions head on for their home state. Empowered by the award-winning, wholly inspiring
Mrs.Barker
, these young kids of "The Fearless Classroom” engaged in a meaningful data-driven activity on Tuva, learning and practicing important data literacy and critical thinking skills.
The students started off by creating a time plot of energy consumed by Texas residents (Texans) from 1984-2011, provided by the
Energy Information Administration
. Analyzing the data, they determined that although the amount of energy being consumed by Texans is increasing every year, the rate of this increase has decreased by almost 50% over the last decade. The students concluded that Texans are moving in the right direction in reducing their energy consumption, and they decided to make it their mission to educate others in their communities about ways to reduce energy consumption to less than 40,000 billion btus over the next 5 years. Of course, as is normally the case in science, students had to be careful about the units. EIA indicates the amount of energy consumed in Billion BTU, and students had to spend some time learning
about British Thermal Units.
They began their mission by first learning a bit about various other source of energy, including solar, wind, hydropower, and biomass energy. They found interesting tidbits about each of these renewable energy sources, including:
1. Did you know that Texas is the leading state in wind power production?
2. Did you know that solar energy is the Earth’s most available energy resource because it can be found anywhere the sun shines?
3. Did you know that hydropower is the cheapest renewable energy source in the US?
4. Did you know that a campfire produces biomass energy through the burning of wood?
Learnings
Young kids digging into real data from data sets provided by a United States Government agency, choosing their own ways to visualize, analyze, and interpret the numbers is a powerful driver for inquiry and discovery. Unknowingly, they observed challenging math concepts such as rate of change in the context of a real-world, meaningful situation. Their observations encouraged them to take action kick-start their own mission, leading them to conduct research into various renewable energy sources and how each source can play an important role in our lives.
How about if you empower your students to explore energy consumed by residents in your home state? What are some way you would extend this activity for your students? You can find all the residential energy consumption data sets on Tuva here. If you can’t find a data set for a particular state or country, please get in touch with us and we will make it available for you.


