Brooklyn students dig into SAT scores on Tuva…and get published! – Tuva Story #2

“Do not train a child to learn by force or harshness; but direct them to it by what amuses their minds, so that you may be better able to discover with accuracy the peculiar bent of the genius of each.”  – Plato

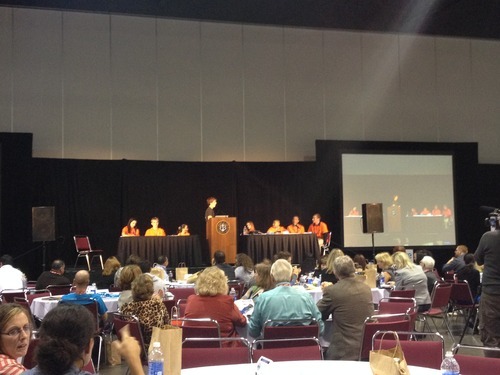
Is there a better sight in the classroom than thirty students at the edge of their seats during first period, digging into real data, engaged in conversations with their peers around a topic that lights a fire to their competitive spirit and captures their imaginations? Last week, we witnessed such a scene in a high school class in Brooklyn. Students, with the SAT exams fresh on their minds, dove deep into the 2012 Critical Reading, Writing, and Math SAT Scores of 32 high schools in Brooklyn. Talk about some friendly inter-borough competition on Tuva!  

By creating scatter and parallel box plot of the SAT scores, they analyzed if students consistently performed better on a particular exam (the median and interquartile range of the scores), explored correlations between the three SAT exams (“Is there a strong correlation in performance on the Writing exam vs. the Critical Reading exam?”), and examined the outlier schools (“What might they be doing differently to be an outlier?”).

We want to thanks their tremendously talented and inspiring teacher, Ms.Terry to make this activity happen. It was a fantastic experience, and it seems that the word regarding this activity spread around Brooklyn very quickly. Technically Brooklyn, a fantastic digital news media site covering Brooklyn, picked up on this lesson and wrote a story about it!
You can read their coverage here: http://technical.ly/brooklyn/2013/11/12/tuva-labs-sats-data/ 

Want to check out some of the students’ work? Here you go:
Student 1: http://tuva.la/1bJsSCI 
Student 2: http://tuva.la/1gYlBmp
Student 3: http://tuva.la/1jgDREy

Check out all of the students’ work here. 

Our mission at Tuva is to empower your students to learn, share, and discover through exploration and analysis of data around their favorite topics. As their teacher, we would love to collaborate with you to bring similar experiences to your classroom. Let’s get started!

How 3rd graders in Texas are impacting their community – Story #1

“You cannot help but learn more as you take the world into your hands. Take it up reverently, for it is an old piece of clay, with millions of thumbprints on it." –  John Updike

Today, we are launching an brand new initiative to share with you short stories of students across the country learning math and statistics through relevant, meaningful, real-world topics on Tuva while building their data literacy, problem-solving, and critical thinking skills. We hope these stories inspire you to conduct similar activities with your students and empower them with the confidence and skills to tackle tomorrow’s challenges.

How much energy do we 

really

 consume? Has the amount of energy we consume been increasing or decreasing over the last few decades? Fourth grade students in McKinney, Texas decided to dig into the real, residential energy consumption data and tackle these questions head on for their home state. Empowered by the award-winning, wholly inspiring 

Mrs.Barker

, these young kids of "The Fearless Classroom” engaged in a meaningful data-driven activity on Tuva, learning and practicing important data literacy and critical thinking skills. 
 
The students started off by creating a time plot of energy consumed by Texas residents (Texans) from 1984-2011, provided by the 

Energy Information Administration

. Analyzing the data, they determined that although the amount of energy being consumed by Texans is increasing every year, the rate of this increase has decreased by almost 50% over the last decade. The students concluded that Texans are moving in the right direction in reducing their energy consumption, and they decided to make it their mission to educate others in their communities about ways to reduce energy consumption to less than 40,000 billion btus over the next 5 years. Of course, as is normally the case in science, students had to be careful about the units. EIA indicates the amount of energy consumed in Billion BTU, and students had to spend some time learning 
about British Thermal Units. 
 
They began their mission by first learning a bit about various other source of energy, including solar, wind, hydropower, and biomass energy. They found interesting tidbits about each of these renewable energy sources, including:
1. Did you know that Texas is the leading state in wind power production? 
2. Did you know that solar energy is the Earth’s most available energy resource because it can be found anywhere the sun shines?
3. Did you know that hydropower is the cheapest renewable energy source in the US?
4. Did you know that a campfire produces biomass energy through the burning of wood? 
 

Learnings

 
Young kids digging into real data from data sets provided by a United States Government agency, choosing their own ways to visualize, analyze, and interpret the numbers is a powerful driver for inquiry and discovery. Unknowingly, they observed challenging math concepts such as rate of change in the context of a real-world, meaningful situation. Their observations encouraged them to take action kick-start their own mission, leading them to conduct research into various renewable energy sources and how each source can play an important role in our lives.
 

How about if you empower your students to explore energy consumed by residents in your home state? What are some way you would extend this activity for your students? You can find all the residential energy consumption data sets on Tuva here. If you can’t find a data set for a particular state or country, please get in touch with us and we will make it available for you.

On the road to Rhode Island and New Jersey

For the last two weekends, the Tuva team has been on the road meeting and greeting with inspiring math and statistics teachers across Rhode Island and New Jersey.

On Oct 5th, we were one of the 20 odd companies that participated in the EdSurge Tech for Schools Summit at the Rhode Island DoE’s annual technology conference in Providence. This Summit was the second such event that the team over at EdSurge has put together this year (first was in Chicago). The goal of the summit was simple – create a forum where ed tech companies can meaningfully engage in a dialogue with educators, learn more about their classroom environments, and allow educators to test their products. The first half of the event didn’t go as planned, and there were plenty of lessons learned for everyone involved in organizing this event. 

A week later, on Oct 12th, Tuva was also in the attendance at the statewide ed tech conference at John Adams Middle School in Edison, NJ. Over three hundred educators came together in Central NJ to attend a variety of sessions on how to integrate free technology tools into their instruction.  

Over the course of these two events, we had the opportunity to interact with many educators, get their feedback on Tuva, and how they are looking for ways to make math learning more relevant, engaging, and personalized for their students. It was a great learning experience for us, and I’d like to share some of these learnings:

1. In many cases, two teachers in the same district teaching the same grades and subjects don’t get an opportunity to interact with one another, share resources, and exchange ideas.

2. Each district has its own policy and suggested best practices regarding teacher’s use of social media to interact with students inside and outside the classroom.

3. Using social media tools to interact with students can sometimes bring about tricky moral dilemmas for teachers when dealing with their students. These dilemmas can be daunting enough to keep teachers away from using social media with their students.  

4. Access to devices and creating 1:1 learning environments is still out of reach of many middle school and high school teachers in these two states. It will be interesting to see how quickly this landscape changes over the next couple of years.   

5. Successfully integrating technology into the classroom environment takes time, lots of patience, sharing of best practices, and a willingness to step outside traditional classroom norms.   

image

A panel of kids talking about what technology in the classroom means to them during lunch hour in Providence, RI

Gap App Prototyping Launch!

Happy Monday! Most of the Tuva team spent a majority of the weekend with math teachers from twelve NYC middle schools and eleven other education technology startup companies at the beautiful offices of ThoughtWorks

We participated in the launch of the historic, first-of-its-kind Gap App Prototype Launch event run by Innovate NYC Schools and facilitated by 4.0 Schools.

Earlier in the Spring of this year, Innovate NYC Schools launched the first ever NYC Gap App Challenge. The goal of this initiative was to challenge software developers to build technology tools that would “enhance math teaching and learning”, and improve engagement amongst students in NYC’s middle schools.

The competition garnered attention amongst software developers and educators across the country, and nearly 200 different tools were submitted. Although Tuva didn’t win the competition, we were one of the twelve finalists selected by the judging panel to begin an extensive collaboration with one iZone middle school for the course of the entire 2013-14 school year. The goal is to work closely with the teachers and students to implement Tuva in their classroom, see what is working, what is not working, and continuously improve Tuva. Needless to say, this is a fantastic opportunity for us and we are honored to be participating in the second part of Innovate NYC’s Gap App Challenge.

We are tremendously excited to be working with three math teachers from IS 228 (Go Brooklyn!). Over the course of the weekend, we got an opportunity to learn more about the school and classroom environment of IS 228, and can’t wait to begin collaborating and working with them for the rest of the year.

A couple of pictures from the event:

image

We were grouped with some awesome other companies including Hapara, Gradeable, and Metryx.

image

Ben and J hard at work building a sketch of a (theoretical) new GPRS system for NYC taxis to increase the safety of Citibikers in NYC.