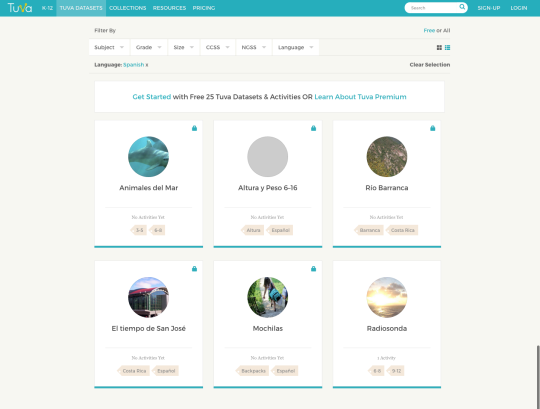
Tuva’s dynamic, easy-to-use data exploration and visualization tools are now available in Spanish.
Today, we are excited to take our first few steps in bringing Tuva’s Data Literacy Solutions to schools, higher education institutions, businesses, and sustainable development organizations globally.
Our dynamic, easy-to-use data exploration and visualization tools are now available in Spanish, enabling Spanish-speaking learners around the world build a strong foundation in data and statistical literacy.
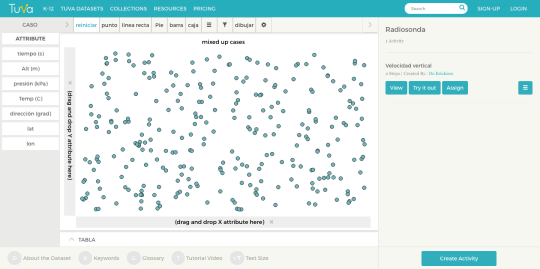
Once you choose your Spanish-language dataset, you will find that all the dataset attributes, as well as all the features and functions on the toolbar are labeled in Spanish.
Over the next couple of weeks, we will make Tuva’s data exploration and visualization tools available in other languages, so please stay tuned for further updates and announcements.
This blog post is written by Molly Schauffler. Dr. Schauffler is an Assistant Research Professor at the University of Maine School of Earth and Climate Sciences.
So, your students have some data. Now what?
One teaching challenge is how to guide students to apply math skills when they “analyze and interpret” data in the context of learning content in other subjects – science, or history, or social science.
Many educators see students stumbling to apply basic data literacy skills such as organizing data, graphing, fitting lines and thinking statistically in general, when working outside of math class with real (often “messy”) data about the real world.
In our work in the Maine Data Literacy Project over the last six years, we observed, over and over again, three glaring weak spots in students’ data literacy:
Lack of a clearly-stated driving question or claim to investigate
Overwhelming tendency to plot data in bar graphs as a default graph choice.
Absence of discussion about variability in data.
We wondered:how could we help students frame clear, statistical questions to drive their inquiry?How could we help them make reasoned decisions about how to visualize data as evidence?How could we help them begin to see, describe, and make sense of variability in data?
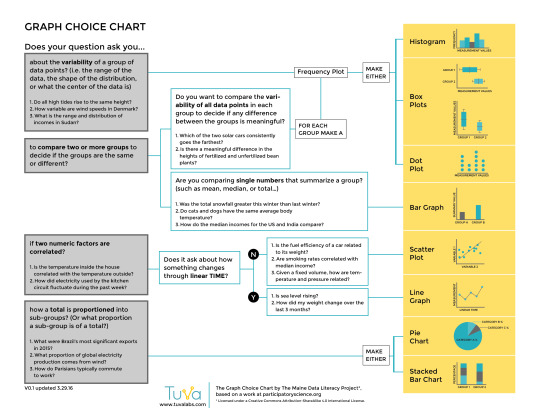
And so, the Graph Choice Chart was born. The Graph Choice Chart (GCC) proposes five types of questions that students are likely to investigate:
Questions about variability within a group
Questions about comparing groups
Questions about Correlations
Questions about change through time (a special kind of correlation)
Questions about how a group is proportioned into sub-groups.
Screenshot of the Graph Choice Chart
Students are prompted to clearly state (write out!) a complete question in one of these forms, and then to follow a decision tree for choosing – based on the nature of their question – what kind graph would make sense to use for developing their evidence.
In addition to helping students clarify the purpose of their analysis, the GCC maps a framework for building statistical thinking and language, informally at first.
Students make deliberate decisions within the framework about what kind of question to ask, what kind of data are needed (categorical or quantitative), and what kind of graph makes sense for visualizing evidence.
It prompts them to adopt language for visualizing and describing variability in data, an underpinning of reasoning about data. Once they master these skills, they are ready to move beyond the GCC to more complex kinds of questions and more quantitative analyses.
Tuva is a perfect environment for putting the Graph Choice Chart to work, whether students are collecting their own data, or working with Tuva Datasets.
In future blogs, we’ll talk more about how early informal focus on variability supports the Common Core Math Standards and is a key underpinning to data literacy.
Download the Graph Choice Chart by logging into your Tuva Dashboard or the Tuva Resources section, and share it with your students and colleagues today.
This blog post is written by Molly Schauffler. Dr. Schauffler is an Assistant Research Professor at the University of Maine School of Earth and Climate Sciences.
Raise your hand if the idea of teaching your students data analysis and statistical thinking is a little unsettling for you.
For many of us who teach social studies, history, language arts, and (yes) even science, it has been a very long time since we took a course in statistics. For many, statistics is a scary label.
Even fewer of us have ever had training in how to incorporate statistical thinking into curriculum for young students. Yet assessments and standards expect our students to analyze and interpret data and make compelling arguments from evidence. Yikes.
The good news is that statistics educators and education researchers, and Tuva, promote an initial exploratory approach to learning how to think statistically about data. Research finds that students have lots to say about data once they have tools, opportunity, and guidance to explore data informally and reason about the stories they find.
Quantitative, or “Confirmatory” statistical analysis comes later, once students grasp challenges of making informal inferences about groups and attributes that are variable.
In Exploratory Data Analysis, students first learn to recognize and talk about variability, and how variability and certainty are related. They learn to explore data, make informal claims, and develop language for describing their data.
If you feel hesitant about guiding students in data analysis, you are not alone. Many of you have asked for some kind of “orientation” for students starting out with data on Tuva.
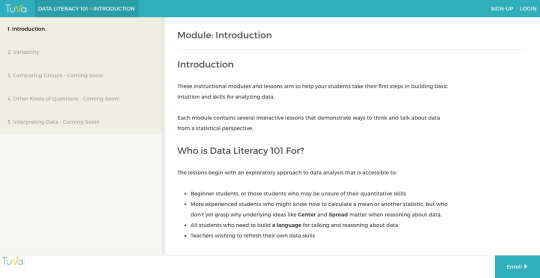
Today, we are excited to launch Data Literacy 101, a course with modules and lessons designed to establish fundamental exploratory data analysis skills (“Level I”).
In the coming weeks, we will add lessons that scaffold students in more quantitative analyses (“Level II”), that then launch them into a grounded and integrated approach to analyzing data as evidence (“Level III”).
Data Literacy 101 lessons incorporate pre- and post-assessment questions to help identify gaps and gains in learning. Lessons are tagged to identify relevant data literacy standards. Follow-on activities will give students practice in skills just learned in a lesson using datasets tagged by content area.
In addition to building students’ skills, Data Literacy 101 is a useful reference if you want to refresh your own familiarity with basic statistical concepts and tools and language.
Data Literacy 101 can help you and your students experience the fun of playing with data and telling the stories they find. Let’s get started!
We have made additional updates to the Filter Bar on Tuva Datasets, following up from our announcement a few weeks ago regarding a more powerful Filter Bar.
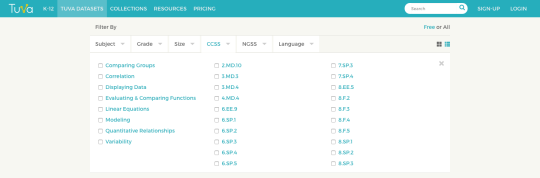
Now, you can filter for Tuva Datasets and activities by a specific Common Core Math Standard, Domain, or Topic.
The CCSS-related Filter categories include: Comparing Groups, Correlation, Comparing Data, Linear Equations, Modeling, Quantitative Relationships, and many topics and standards.
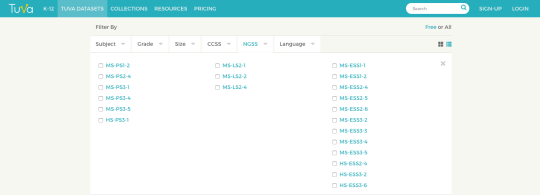
In addition, we are continuing to extend our coverage of the Next Generation Science Standards, and have curated a number of fantastic new datasets covering additional NGSS Physical Science, Life Science, and Earth & Space Science standards. To learn more, explore all the datasets in our Tuva Datasets Library.
Remember, you can always reach out to us if you are unable to find a dataset for your needs.
During the initial design phase of Tuva Activities and Lessons, one critical decision we made was that activities on Tuva would only initially support one item type – open-ended questions.
Why? We felt that activities and lessons based on authentic datasets gave both educators and learners a unique opportunity to look beyond the straightforward multiple-choice and True/False questions.
With actual data and tools at our fingertips, educators can pose a number of interesting, open-ended questions that gave learners an opportunity to:
Practice and gain exposure to the language of data, statistics, and graphing.
Construct arguments and support their reasoning with evidence from the data and their own visuals.
Explain their thinking in words, giving them an opportunity to focus on their grammar, sentence construction, as well as learn the techniques of quantitative reasoning.
Describe in words the various aspects of the data, including:
Any patterns or interesting phenomenon they discover.
Distribution of various attributes, such as its shape, its spread, or its center
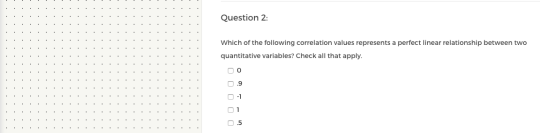
Image: New Item Type on Tuva
Over the last twelve months, we have received a variety of feedback from educators across math, science, statistics, and many other subject areas about being able to ask (and immediately grade) straightforward, multiple-choice questions at the beginning of the activity to assess for basic understanding, and then gradually build towards the more difficult, open-ended questions.
I am excited to announce that we will soon be adding these two new features – Multiple Choice Questions and Automatic Grading – to Tuva Activities and Lessons.
For Tuva Basic teachers, you will be able preview these new features via a number of different activities on the 25 Free Tuva Datasets.
For Tuva Premium subscribers, you will see this feature gradually introduced across all of our 400+ activities and lessons around 315+ datasets, as well as many of the new activities and lessons we release moving forward.